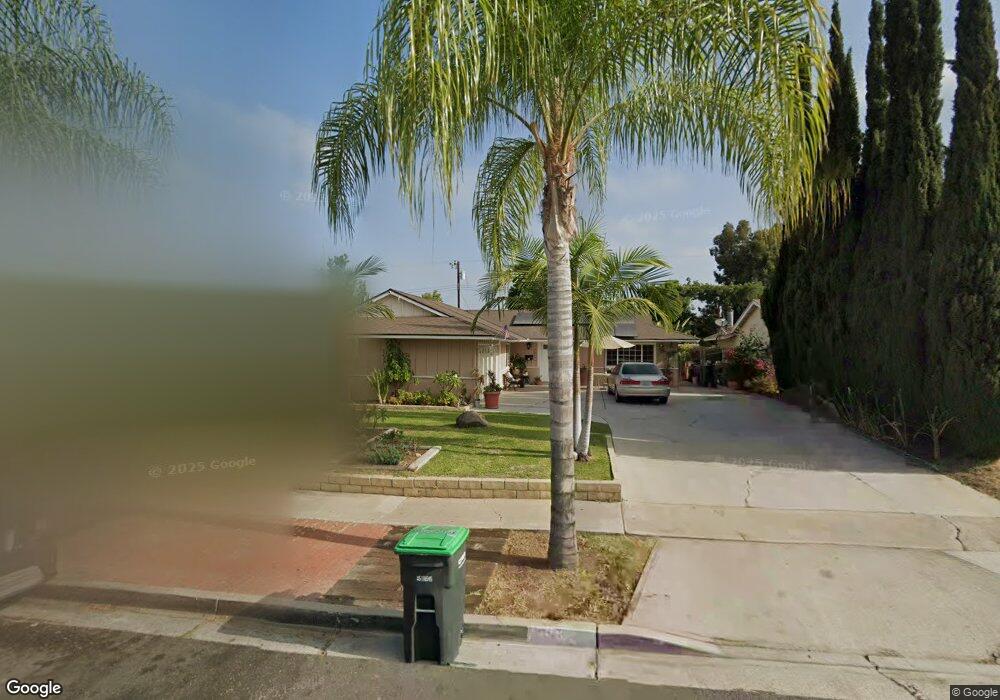
19081 E Ryals Ln Orange, CA 92869
Estimated Value: $907,037 - $1,500,000
3
Beds
2
Baths
1,357
Sq Ft
$795/Sq Ft
Est. Value
About This Home
This home is located at 19081 E Ryals Ln, Orange, CA 92869 and is currently estimated at $1,078,759, approximately $794 per square foot. 19081 E Ryals Ln is a home located in Orange County with nearby schools including Esplanade Elementary School, El Modena High School, and Orange County Classical Academy.
Ownership History
Date
Name
Owned For
Owner Type
Purchase Details
Closed on
Dec 10, 2024
Sold by
Molina Jesus and Molina Virginia
Bought by
Molina Family Revocable Living Trust and Molina
Current Estimated Value
Purchase Details
Closed on
Aug 25, 2005
Sold by
Molina Jesus and Molina Virginia
Bought by
Molina Jesus and Molina Virginia
Home Financials for this Owner
Home Financials are based on the most recent Mortgage that was taken out on this home.
Original Mortgage
$152,000
Interest Rate
5.61%
Mortgage Type
New Conventional
Purchase Details
Closed on
Mar 20, 1999
Sold by
Refugio Molina Jesus and Cortez Virginia
Bought by
Molina Jesus and Molina Virginia
Home Financials for this Owner
Home Financials are based on the most recent Mortgage that was taken out on this home.
Original Mortgage
$157,300
Interest Rate
6.73%
Create a Home Valuation Report for This Property
The Home Valuation Report is an in-depth analysis detailing your home's value as well as a comparison with similar homes in the area
Home Values in the Area
Average Home Value in this Area
Purchase History
| Date | Buyer | Sale Price | Title Company |
|---|---|---|---|
| Molina Family Revocable Living Trust | -- | None Listed On Document | |
| Molina Jesus | -- | Ticor Title Company | |
| Molina Jesus | -- | Landsafe Title |
Source: Public Records
Mortgage History
| Date | Status | Borrower | Loan Amount |
|---|---|---|---|
| Previous Owner | Molina Jesus | $152,000 | |
| Previous Owner | Molina Jesus | $157,300 |
Source: Public Records
Tax History
| Year | Tax Paid | Tax Assessment Tax Assessment Total Assessment is a certain percentage of the fair market value that is determined by local assessors to be the total taxable value of land and additions on the property. | Land | Improvement |
|---|---|---|---|---|
| 2025 | $3,578 | $307,313 | $228,306 | $79,007 |
| 2024 | $3,578 | $301,288 | $223,830 | $77,458 |
| 2023 | $3,496 | $295,381 | $219,441 | $75,940 |
| 2022 | $3,427 | $289,590 | $215,139 | $74,451 |
| 2021 | $3,334 | $283,912 | $210,920 | $72,992 |
| 2020 | $3,303 | $281,001 | $208,757 | $72,244 |
| 2019 | $3,264 | $275,492 | $204,664 | $70,828 |
| 2018 | $3,215 | $270,091 | $200,651 | $69,440 |
| 2017 | $3,087 | $264,796 | $196,717 | $68,079 |
| 2016 | $3,029 | $259,604 | $192,859 | $66,745 |
| 2015 | $2,984 | $255,705 | $189,962 | $65,743 |
| 2014 | $2,921 | $250,697 | $186,241 | $64,456 |
Source: Public Records
Map
Nearby Homes
- 19091 E Country Hollow Unit 34
- 19031 E Center Ave
- 18946 E Berrytree Ln
- 186 N Quail Ln
- 4900 E Chapman Ave Unit 51
- 5519 E Avenida Palmar
- 19002 E Smiley Dr
- 12348 Circula Panorama
- 5722 E Stillwater Ave Unit 10
- 5722 E Stillwater Ave Unit 113
- 5744 E Creekside Ave Unit 37
- 12384 Circula Panorama
- 12281 Baja Panorama
- 12281 Alta Panorama
- 4223 E Marmon Ave
- 10372 Crawford Canyon Rd
- 126 S Waterwheel Way
- 6036 E Cadbury Dr Unit 53
- 12574 Vista Panorama
- 19322 Saylor Terrace
- 19091 E Ryals Ln
- 19071 E Ryals Ln
- 19012 E Country Hollow Unit 1
- 19012 E Country Hollow
- 19022 E Country Hollow Unit 12
- 19042 E Country Hollow Unit 3
- 19052 E Country Hollow Unit 4
- 19101 E Ryals Ln
- 19051 E Ryals Ln
- 19062 E Country Hollow Unit 13
- 19066 E Country Hollow Unit 14
- 19072 E Country Hollow
- 19072 E Country Hollow Unit 15
- 19111 E Ryals Ln
- 19082 E Ryals Ln
- 19076 E Country Hollow Unit 16
- 19041 E Ryals Ln
- 19072 E Ryals Ln
- 19092 E Ryals Ln
- 19095 E Country Hollow Unit 33
Your Personal Tour Guide
Ask me questions while you tour the home.