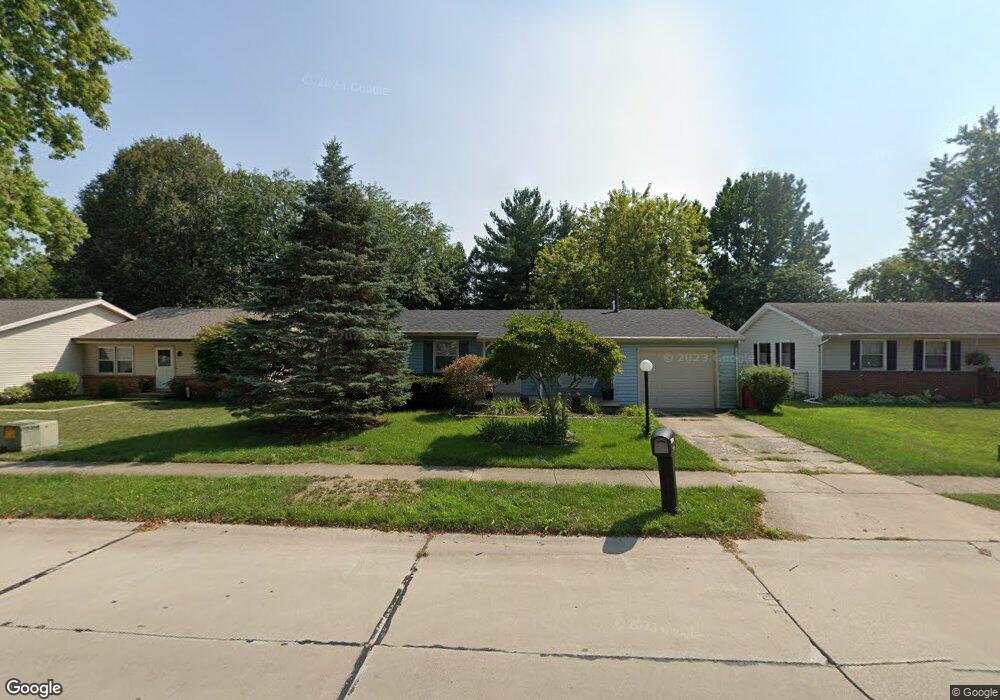
1909 Branch Rd Champaign, IL 61821
West Haven NeighborhoodEstimated Value: $229,000 - $253,000
--
Bed
2
Baths
1,604
Sq Ft
$151/Sq Ft
Est. Value
About This Home
This home is located at 1909 Branch Rd, Champaign, IL 61821 and is currently estimated at $242,835, approximately $151 per square foot. 1909 Branch Rd is a home located in Champaign County with nearby schools including Centennial High School, St. John Lutheran School, and Montessori Habitat School.
Ownership History
Date
Name
Owned For
Owner Type
Purchase Details
Closed on
Dec 16, 2013
Sold by
Twine Ronald W
Bought by
Michael Marissa E
Current Estimated Value
Home Financials for this Owner
Home Financials are based on the most recent Mortgage that was taken out on this home.
Original Mortgage
$133,215
Outstanding Balance
$98,218
Interest Rate
3.87%
Mortgage Type
FHA
Estimated Equity
$144,617
Purchase Details
Closed on
Mar 14, 2008
Sold by
Anderson Lynn E and Watson Lynn A
Bought by
Twine Ronald W and Twine Marissa E
Home Financials for this Owner
Home Financials are based on the most recent Mortgage that was taken out on this home.
Original Mortgage
$130,161
Interest Rate
5.74%
Mortgage Type
FHA
Create a Home Valuation Report for This Property
The Home Valuation Report is an in-depth analysis detailing your home's value as well as a comparison with similar homes in the area
Home Values in the Area
Average Home Value in this Area
Purchase History
| Date | Buyer | Sale Price | Title Company |
|---|---|---|---|
| Michael Marissa E | -- | Meymax Title Agency | |
| Twine Ronald W | $132,000 | None Available |
Source: Public Records
Mortgage History
| Date | Status | Borrower | Loan Amount |
|---|---|---|---|
| Open | Michael Marissa E | $133,215 | |
| Previous Owner | Twine Ronald W | $130,161 |
Source: Public Records
Tax History Compared to Growth
Tax History
| Year | Tax Paid | Tax Assessment Tax Assessment Total Assessment is a certain percentage of the fair market value that is determined by local assessors to be the total taxable value of land and additions on the property. | Land | Improvement |
|---|---|---|---|---|
| 2024 | $4,422 | $60,430 | $18,530 | $41,900 |
| 2023 | $4,422 | $55,040 | $16,880 | $38,160 |
| 2022 | $4,117 | $50,770 | $15,570 | $35,200 |
| 2021 | $4,007 | $49,770 | $15,260 | $34,510 |
| 2020 | $3,837 | $47,850 | $14,670 | $33,180 |
| 2019 | $3,703 | $46,870 | $14,370 | $32,500 |
| 2018 | $3,611 | $46,130 | $14,140 | $31,990 |
| 2017 | $3,626 | $46,130 | $14,140 | $31,990 |
| 2016 | $3,241 | $45,180 | $13,850 | $31,330 |
| 2015 | $3,257 | $44,380 | $13,600 | $30,780 |
| 2014 | $3,229 | $44,380 | $13,600 | $30,780 |
| 2013 | $3,200 | $44,380 | $13,600 | $30,780 |
Source: Public Records
Map
Nearby Homes
- 1901 Branch Rd
- 1928 Blackthorn Dr Unit 1
- 2113 Sunview Dr
- 2306 Winchester Dr
- 2144 Harbortown Cir Unit 2144
- 2001 S Mattis Ave Unit E
- 1908 Barberry Cir
- 2302 Blackthorn Dr
- 1901 Lakeside Dr Unit B
- 2313 Glenoak Dr
- 2505 Windward Blvd Unit 2505
- 2404 Windward Blvd Unit 202
- 2521 Windward Blvd Unit 2521
- 2002 O Donnell Dr
- 2521 Pembrook Point
- 1801 Crescent Dr
- 2410 Stillwater Dr
- 2409 Morrissey Park Dr Unit 2409
- 2009 Southwood Dr
- 2801 Valleybrook Dr