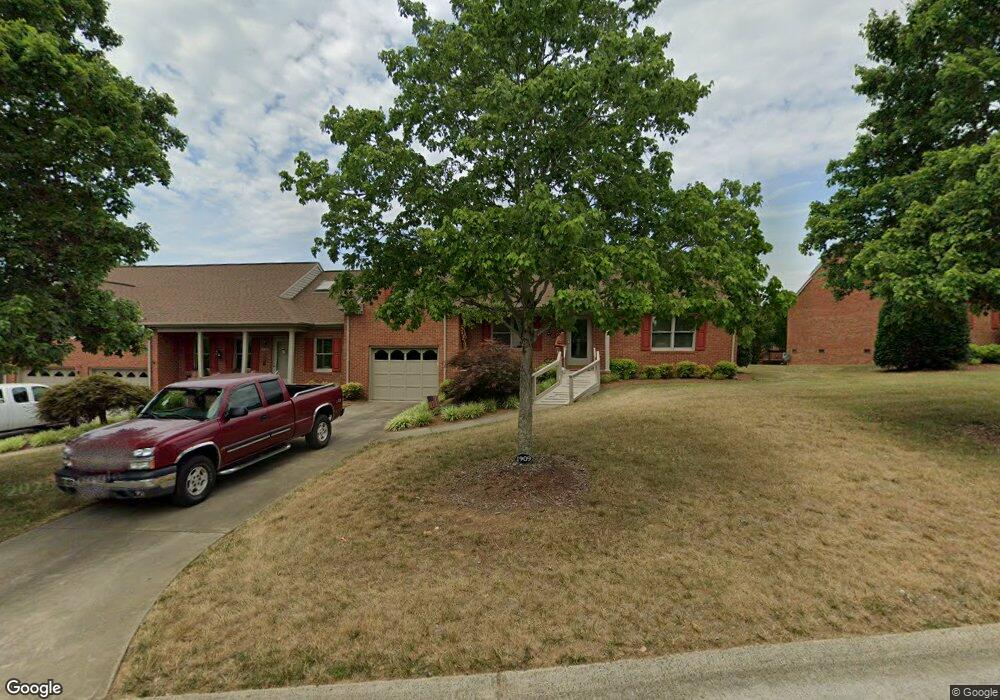
1909 Springmeadow Dr Graham, NC 27253
Estimated Value: $253,000 - $266,000
3
Beds
3
Baths
1,530
Sq Ft
$168/Sq Ft
Est. Value
About This Home
This home is located at 1909 Springmeadow Dr, Graham, NC 27253 and is currently estimated at $256,460, approximately $167 per square foot. 1909 Springmeadow Dr is a home located in Alamance County with nearby schools including South Graham Elementary School, Southern Alamance Middle School, and Southern Alamance High School.
Ownership History
Date
Name
Owned For
Owner Type
Purchase Details
Closed on
Jan 7, 2025
Sold by
Jayjac Llc
Bought by
Sledge Ellen Sue
Current Estimated Value
Purchase Details
Closed on
Nov 5, 2024
Sold by
Stout Peggy Jean Ray and Farrell Deborah Stout
Bought by
Jayjac Llc
Purchase Details
Closed on
May 2, 2024
Sold by
Stout Peggy Jean Ray
Bought by
Stout Farrell Deborah
Purchase Details
Closed on
Jul 13, 1999
Sold by
Murray Earl O
Bought by
Stout Clarence O
Home Financials for this Owner
Home Financials are based on the most recent Mortgage that was taken out on this home.
Original Mortgage
$140,000
Interest Rate
7.23%
Create a Home Valuation Report for This Property
The Home Valuation Report is an in-depth analysis detailing your home's value as well as a comparison with similar homes in the area
Home Values in the Area
Average Home Value in this Area
Purchase History
| Date | Buyer | Sale Price | Title Company |
|---|---|---|---|
| Sledge Ellen Sue | $255,000 | None Listed On Document | |
| Sledge Ellen Sue | $255,000 | None Listed On Document | |
| Jayjac Llc | $210,000 | None Listed On Document | |
| Stout Farrell Deborah | -- | None Listed On Document | |
| Stout Farrell Deborah | -- | None Listed On Document | |
| Stout Clarence O | $151,000 | -- |
Source: Public Records
Mortgage History
| Date | Status | Borrower | Loan Amount |
|---|---|---|---|
| Previous Owner | Stout Clarence O | $140,000 |
Source: Public Records
Tax History Compared to Growth
Tax History
| Year | Tax Paid | Tax Assessment Tax Assessment Total Assessment is a certain percentage of the fair market value that is determined by local assessors to be the total taxable value of land and additions on the property. | Land | Improvement |
|---|---|---|---|---|
| 2025 | $1,134 | $229,627 | $28,000 | $201,627 |
| 2024 | $1,077 | $229,627 | $28,000 | $201,627 |
| 2023 | $987 | $229,627 | $28,000 | $201,627 |
| 2022 | $1,608 | $145,989 | $25,000 | $120,989 |
| 2021 | $1,623 | $145,989 | $25,000 | $120,989 |
| 2020 | $1,637 | $145,989 | $25,000 | $120,989 |
| 2019 | $1,642 | $145,989 | $25,000 | $120,989 |
| 2018 | $0 | $145,989 | $25,000 | $120,989 |
| 2017 | $843 | $145,989 | $25,000 | $120,989 |
| 2016 | $1,576 | $152,259 | $25,000 | $127,259 |
| 2015 | $879 | $152,259 | $25,000 | $127,259 |
| 2014 | -- | $152,259 | $25,000 | $127,259 |
Source: Public Records
Map
Nearby Homes
- 1960 Meadowview Dr
- 1960 Meadowview Dr Unit Lot 1
- 1990 Meadowview Dr
- 1994 Meadowview Dr
- 548 Little Creek Dr
- 1975 Meadowview Dr
- 1975 Meadowview Dr Unit lot 15
- 1985 Meadowview Dr
- 1985 Meadowview Dr Unit Lot 13
- 1987 Meadowview Dr
- 1987 Meadowview Dr Unit lot 12
- 1995 Meadowview Dr
- 1995 Meadowview Dr Unit Lot 10
- 1999 Meadowview Dr Unit lot 9
- 1999 Meadowview Dr
- 0 Rogers Rd Unit 10122339
- Cary 3 Plan at Meadowview Glen
- Somerset 3 Plan at Meadowview Glen
- Cotswold 3 Plan at Meadowview Glen
- Pinehurst 3 Plan at Meadowview Glen
- 1911 Springmeadow Dr
- 1905 Springmeadow Dr
- 1913 Springmeadow Dr
- 1910 Meadow Green Dr
- 1906 Meadow Green Dr
- 1903 Springmeadow Dr
- 1912 Meadow Green Dr
- 1906 Springmeadow Dr
- 1910 Springmeadow Dr
- 1904 Meadow Green Dr
- 1914 Springmeadow Dr
- 1914 Springmeadow Dr
- 1917 Springmeadow Dr
- 1912 Springmeadow Dr
- 1901 Springmeadow Dr
- 1914 Meadow Green Dr
- 1904 Springmeadow Dr
- 1902 Meadowgreen Dr
- 1902 Meadow Green Dr
- 1916 Springmeadow Dr