1909 Webster St Chillicothe, MO 64601
Estimated Value: $228,000 - $295,000
About This Home
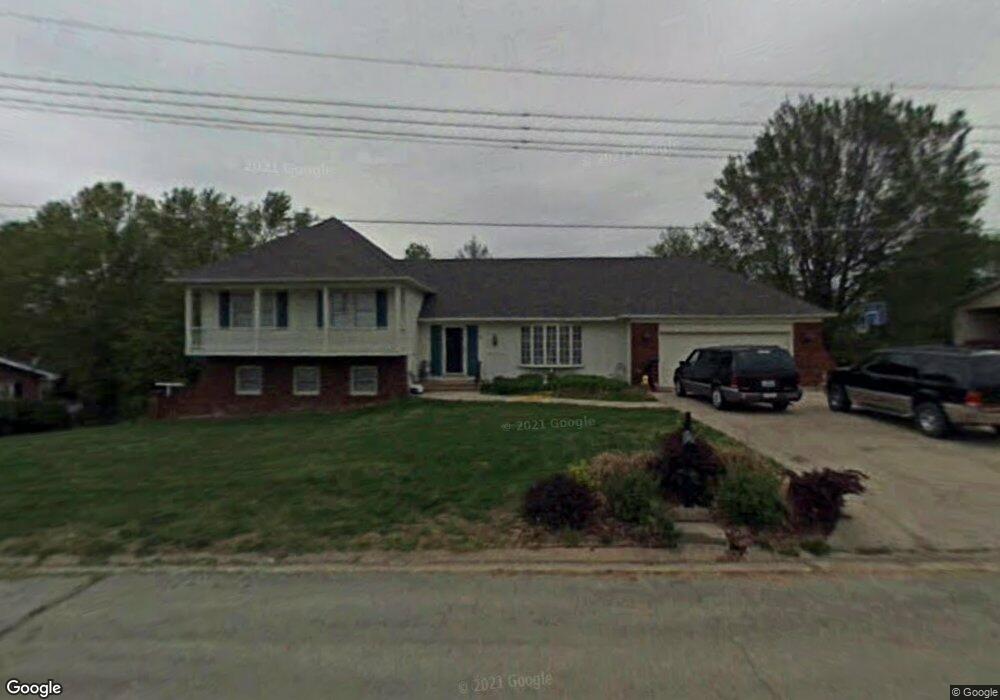
This home is located at 1909 Webster St, Chillicothe, MO 64601 and is currently estimated at $271,662, approximately $82 per square foot. 1909 Webster St is a home located in Livingston County with nearby schools including Chillicothe Elementary School, Dewey Elementary School, and Field Elementary School.
Ownership History
We collect this data history from publicly available records. To have your information removed, we recommend requesting removal directly through your county’s website.
Purchase Details
Home Financials for this Owner
Home Financials are based on the most recent Mortgage that was taken out on this home.Purchase Details
Home Financials for this Owner
Home Financials are based on the most recent Mortgage that was taken out on this home.Purchase Details
Purchase Details
Home Values in the Area
Average Home Value in this Area
Purchase History
We collect this data history from publicly available records. To have your information removed, we recommend requesting removal directly through your county’s website.
| Date | Buyer | Sale Price | Title Company |
|---|---|---|---|
| -- | None Listed On Document | ||
| -- | None Listed On Document | ||
| -- | -- | ||
| -- | -- |
Mortgage History
We collect this data history from publicly available records. To have your information removed, we recommend requesting removal directly through your county’s website.
| Date | Status | Borrower | Loan Amount |
|---|---|---|---|
| Open | $242,000 | ||
| Previous Owner | $384,750 |
Tax History
We collect this data history from publicly available records. To have your information removed, we recommend requesting removal directly through your county’s website.
| Year | Tax Paid | Tax Assessment Tax Assessment Total Assessment is a certain percentage of the fair market value that is determined by local assessors to be the total taxable value of land and additions on the property. | Land | Improvement |
|---|---|---|---|---|
| 2025 | $2,875 | $40,480 | $4,700 | $35,780 |
| 2024 | $2,875 | $38,740 | $4,700 | $34,040 |
| 2023 | $2,814 | $38,740 | $4,700 | $34,040 |
| 2022 | $2,150 | $29,810 | $4,700 | $25,110 |
| 2020 | $1,911 | $26,260 | $4,700 | $21,560 |
| 2019 | $1,905 | $26,260 | $4,700 | $21,560 |
| 2018 | $1,921 | $26,590 | $4,700 | $21,890 |
| 2017 | $1,921 | $26,590 | $4,700 | $21,890 |
| 2016 | -- | $25,080 | $4,180 | $20,900 |
| 2015 | -- | $25,080 | $4,180 | $20,900 |
| 2011 | -- | $132,010 | $22,000 | $110,010 |
Map
- 1915 Webster St
- 1905 Webster St
- 1908 Webster St
- 1908 Calhoun St
- 1904 Calhoun St
- 620 Boehner Place
- 1904 Webster St
- 1901 Webster St
- 1910 Calhoun St
- 1900 Calhoun St
- 616 Boehner Place
- 1900 Webster St
- 603 Boehner Place
- 1909 Calhoun St
- 608 Grandview St
- 1905 Calhoun St
- 2005 Webster St
- 2000 Calhoun St
- 1915 Calhoun St
- 601 Boehner Place
Ask me questions while you tour the home.