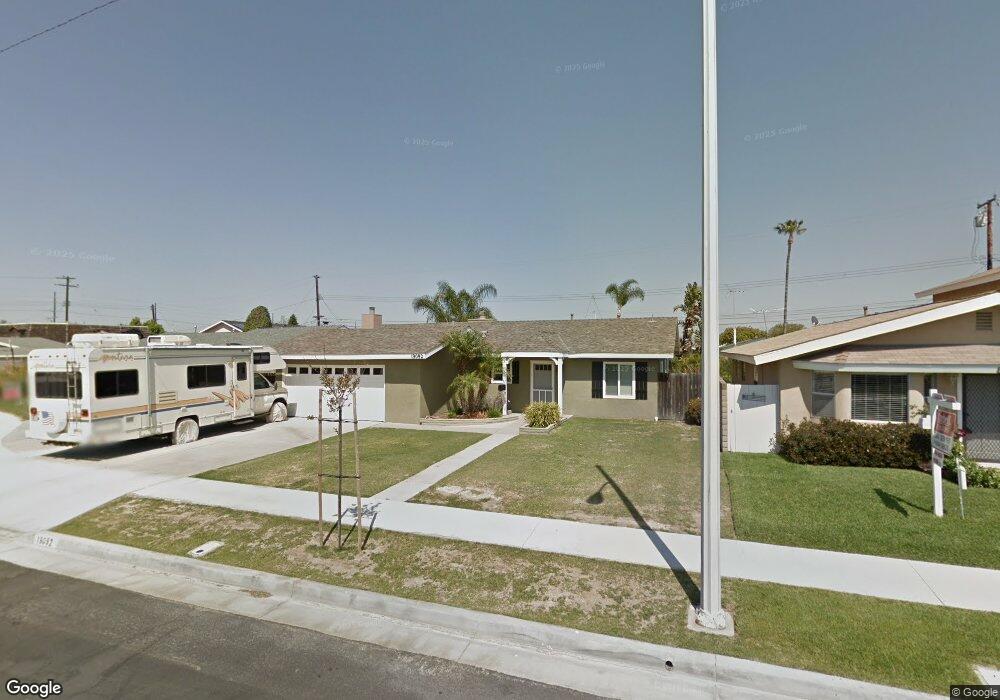
19092 Carp Cir Huntington Beach, CA 92646
Estimated Value: $1,159,000 - $1,270,000
3
Beds
2
Baths
1,402
Sq Ft
$862/Sq Ft
Est. Value
About This Home
This home is located at 19092 Carp Cir, Huntington Beach, CA 92646 and is currently estimated at $1,208,029, approximately $861 per square foot. 19092 Carp Cir is a home located in Orange County with nearby schools including Isojiro Oka Elementary, Talbert Middle School, and Huntington Beach High School.
Ownership History
Date
Name
Owned For
Owner Type
Purchase Details
Closed on
Aug 25, 1997
Sold by
Harris Mike L and Harris Lin W
Bought by
Harris Mike L and Harris Cathy M
Current Estimated Value
Purchase Details
Closed on
Oct 30, 1995
Sold by
Harris Lisa
Bought by
Harris Mike L
Home Financials for this Owner
Home Financials are based on the most recent Mortgage that was taken out on this home.
Original Mortgage
$148,400
Outstanding Balance
$1,032
Interest Rate
7.51%
Estimated Equity
$1,206,997
Purchase Details
Closed on
Oct 23, 1995
Sold by
Snow Stanley D and Snow Lori L
Bought by
Harris Mike L and Harris Lin W
Home Financials for this Owner
Home Financials are based on the most recent Mortgage that was taken out on this home.
Original Mortgage
$148,400
Outstanding Balance
$1,032
Interest Rate
7.51%
Estimated Equity
$1,206,997
Create a Home Valuation Report for This Property
The Home Valuation Report is an in-depth analysis detailing your home's value as well as a comparison with similar homes in the area
Home Values in the Area
Average Home Value in this Area
Purchase History
| Date | Buyer | Sale Price | Title Company |
|---|---|---|---|
| Harris Mike L | -- | -- | |
| Harris Mike L | -- | South Coast Title Company | |
| Harris Mike L | $185,500 | South Coast Title Company |
Source: Public Records
Mortgage History
| Date | Status | Borrower | Loan Amount |
|---|---|---|---|
| Open | Harris Mike L | $148,400 |
Source: Public Records
Tax History Compared to Growth
Tax History
| Year | Tax Paid | Tax Assessment Tax Assessment Total Assessment is a certain percentage of the fair market value that is determined by local assessors to be the total taxable value of land and additions on the property. | Land | Improvement |
|---|---|---|---|---|
| 2025 | $3,617 | $308,155 | $204,459 | $103,696 |
| 2024 | $3,617 | $302,113 | $200,450 | $101,663 |
| 2023 | $3,529 | $296,190 | $196,520 | $99,670 |
| 2022 | $3,473 | $290,383 | $192,667 | $97,716 |
| 2021 | $3,406 | $284,690 | $188,890 | $95,800 |
| 2020 | $3,384 | $281,771 | $186,953 | $94,818 |
| 2019 | $3,317 | $276,247 | $183,288 | $92,959 |
| 2018 | $3,254 | $270,831 | $179,694 | $91,137 |
| 2017 | $3,202 | $265,521 | $176,171 | $89,350 |
| 2016 | $3,069 | $260,315 | $172,716 | $87,599 |
| 2015 | $3,021 | $256,405 | $170,121 | $86,284 |
| 2014 | $2,960 | $251,383 | $166,789 | $84,594 |
Source: Public Records
Map
Nearby Homes
- 9462 Litchfield Dr
- 19251 Brookhurst St Unit 137
- 19251 Brookhurst St Unit 13
- 19251 Brookhurst St Unit 48
- 19251 Brookhurst St Unit 11
- 19251 Brookhurst St Unit 38
- 19251 Brookhurst St Unit 69
- 19251 Brookhurst St Unit 22
- 9850 Garfield Ave Unit 129
- 9850 Garfield Ave Unit 18
- 9850 Garfield Ave Unit 91
- 9850 Garfield Ave Unit 35
- 9850 Garfield Ave Unit 5
- 9850 Garfield Ave Unit 130
- 9850 Garfield Ave Unit 33
- 19361 Brookhurst St Unit 87
- 19361 Brookhurst St Unit 50
- 19361 Brookhurst St Unit 184
- 19361 Brookhurst St Unit 22
- 19361 Brookhurst St Unit 159
- 19102 Carp Cir
- 19082 Carp Cir
- 19091 Stingray Ln
- 19112 Carp Cir
- 19081 Stingray Ln
- 19101 Stingray Ln
- 19072 Carp Cir
- 19071 Stingray Ln
- 19111 Stingray Ln
- 19091 Carp Cir
- 19101 Carp Cir Unit 1
- 19101 Carp Cir
- 19122 Carp Cir
- 19081 Carp Cir
- 19062 Carp Cir
- 19111 Carp Cir
- 19061 Stingray Ln
- 19121 Stingray Ln
- 19071 Carp Cir
- 19132 Carp Cir