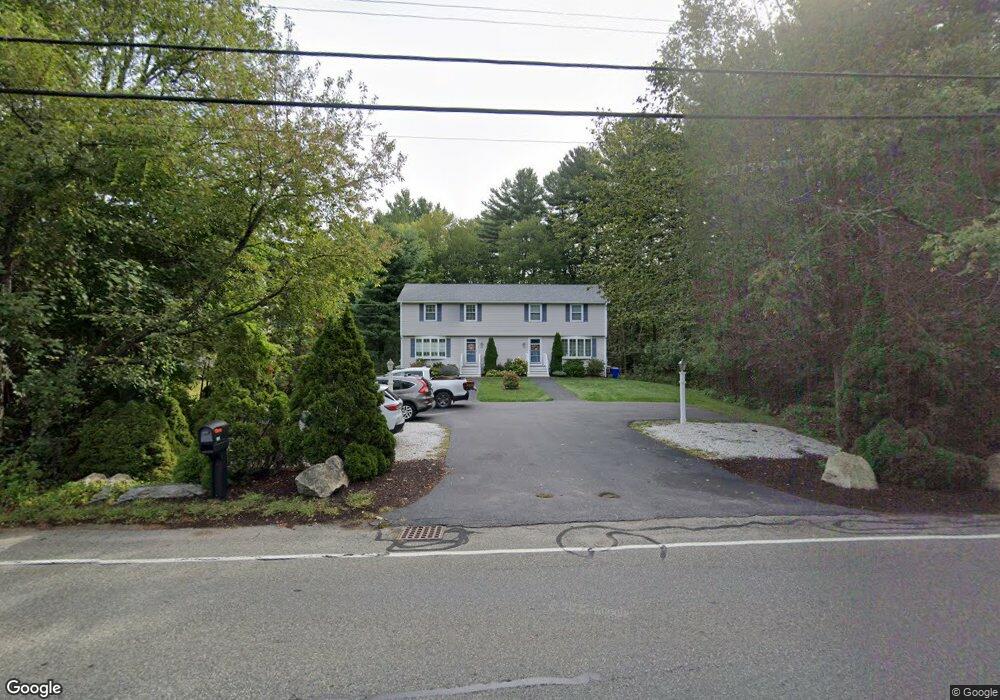
191 Hingham St Rockland, MA 02370
Estimated Value: $569,000 - $1,086,000
3
Beds
4
Baths
2,916
Sq Ft
$282/Sq Ft
Est. Value
About This Home
This home is located at 191 Hingham St, Rockland, MA 02370 and is currently estimated at $823,371, approximately $282 per square foot. 191 Hingham St is a home located in Plymouth County with nearby schools including Rockland Senior High School, Calvary Chapel Academy, and Holy Family Elementary School.
Ownership History
Date
Name
Owned For
Owner Type
Purchase Details
Closed on
Oct 14, 2025
Sold by
Fulford Joanna
Bought by
Fulford John R and Fulford Joanna L
Current Estimated Value
Purchase Details
Closed on
Jun 21, 2017
Sold by
Urciuoli Maria and Urciuoli Sabino
Bought by
Fulford Joanna
Purchase Details
Closed on
Apr 14, 1994
Sold by
Wheeler James F
Bought by
Fulford John and Fulford Joanna
Home Financials for this Owner
Home Financials are based on the most recent Mortgage that was taken out on this home.
Original Mortgage
$168,000
Interest Rate
7.45%
Mortgage Type
Purchase Money Mortgage
Create a Home Valuation Report for This Property
The Home Valuation Report is an in-depth analysis detailing your home's value as well as a comparison with similar homes in the area
Home Values in the Area
Average Home Value in this Area
Purchase History
| Date | Buyer | Sale Price | Title Company |
|---|---|---|---|
| Fulford John R | -- | -- | |
| Fulford Joanna | -- | -- | |
| Fulford John | $78,000 | -- | |
| Fulford John | $78,000 | -- |
Source: Public Records
Mortgage History
| Date | Status | Borrower | Loan Amount |
|---|---|---|---|
| Previous Owner | Fulford John | $105,000 | |
| Previous Owner | Fulford John | $125,266 | |
| Previous Owner | Fulford John | $136,750 | |
| Previous Owner | Fulford John | $168,000 |
Source: Public Records
Tax History Compared to Growth
Tax History
| Year | Tax Paid | Tax Assessment Tax Assessment Total Assessment is a certain percentage of the fair market value that is determined by local assessors to be the total taxable value of land and additions on the property. | Land | Improvement |
|---|---|---|---|---|
| 2025 | $9,687 | $708,600 | $239,100 | $469,500 |
| 2024 | $9,486 | $674,700 | $225,500 | $449,200 |
| 2023 | $9,271 | $609,100 | $196,400 | $412,700 |
| 2022 | $8,876 | $529,900 | $170,800 | $359,100 |
| 2021 | $8,419 | $487,200 | $155,300 | $331,900 |
| 2020 | $8,124 | $464,200 | $147,900 | $316,300 |
| 2019 | $7,586 | $423,300 | $140,800 | $282,500 |
| 2018 | $7,250 | $397,900 | $140,800 | $257,100 |
| 2017 | $6,930 | $375,000 | $140,800 | $234,200 |
| 2016 | $6,725 | $363,700 | $135,400 | $228,300 |
| 2015 | $6,411 | $336,900 | $126,600 | $210,300 |
| 2014 | $6,109 | $333,100 | $124,200 | $208,900 |
Source: Public Records
Map
Nearby Homes
- 206-208 Hinghm St
- 18 Midfield Dr
- 354 Webster St
- 436 E Water St
- 507 Liberty St
- 141 Deerfield Ln
- 83 Summit St
- 120 Deerfield Ln
- 7 Boxberry Ln Unit 7
- 216 Whiting St
- 737-739 Union St
- 63 Webster St
- 775 Union St
- 14 Dyer St Unit 14
- 12 Dyer St Unit 12
- 13 Dyer St Unit 13
- 65 Boxberry Ln
- 11 Dyer St Unit 11
- 45-47 Park St
- 35-37 Salem St
- 205 Hingham St
- 165 Hingham St
- 206 Hingham St Unit 208
- 221 Hingham St
- 194 Hingham St
- 208 Hingham St
- 178 Hingham St
- 206-208 Hingham St
- 163 Hingham St
- 220 Hingham St
- 168 Hingham St
- 231 Hingham St
- 230 Hingham St
- 186 Hingham St
- 139 Hingham St
- 245 Hingham St
- 156 Hingham St
- 135 Hingham St
- 253 Hingham St
- 250 Hingham St