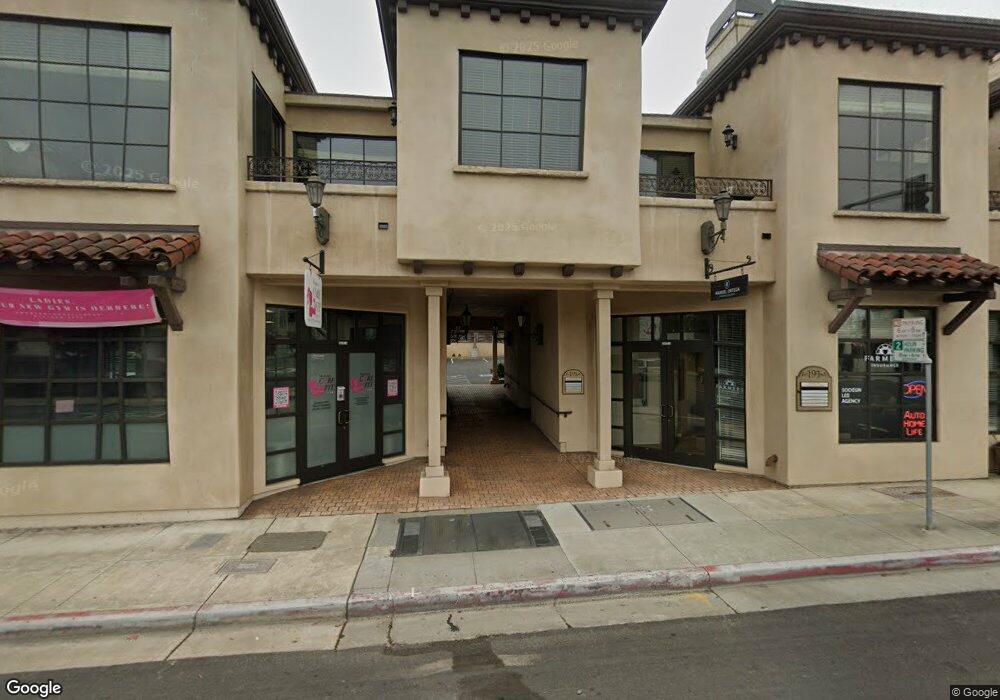
191 Lighthouse Ave Unit 5 Monterey, CA 93940
New Monterey NeighborhoodEstimated Value: $6,262,416
2
Beds
1
Bath
1,215
Sq Ft
$5,154/Sq Ft
Est. Value
About This Home
This home is located at 191 Lighthouse Ave Unit 5, Monterey, CA 93940 and is currently estimated at $6,262,416, approximately $5,154 per square foot. 191 Lighthouse Ave Unit 5 is a home located in Monterey County with nearby schools including Monte Vista Elementary School, Monte Vista Middle School, and Monterey High School.
Ownership History
Date
Name
Owned For
Owner Type
Purchase Details
Closed on
Nov 23, 2015
Sold by
Chang Hsiao Yun
Bought by
Lan Chi Yaw
Current Estimated Value
Purchase Details
Closed on
Nov 20, 2015
Sold by
Shar Holley David R and Shar David R Holley M D Profit
Bought by
Lan Chi Yaw and Lan Yueh Tze
Purchase Details
Closed on
Jun 17, 2008
Sold by
Sagin Richard Vito
Bought by
Holley David R and The David R Holley Md Profit S
Home Financials for this Owner
Home Financials are based on the most recent Mortgage that was taken out on this home.
Original Mortgage
$2,544,463
Interest Rate
6.04%
Mortgage Type
Commercial
Purchase Details
Closed on
Jul 8, 2004
Sold by
Dechakit Inc
Bought by
Sagin Richard Vito
Home Financials for this Owner
Home Financials are based on the most recent Mortgage that was taken out on this home.
Original Mortgage
$350,000
Interest Rate
6.27%
Mortgage Type
Seller Take Back
Create a Home Valuation Report for This Property
The Home Valuation Report is an in-depth analysis detailing your home's value as well as a comparison with similar homes in the area
Home Values in the Area
Average Home Value in this Area
Purchase History
We collect this data history from publicly available records. To have your information removed, we recommend requesting removal directly through your county’s website.
| Date | Buyer | Sale Price | Title Company |
|---|---|---|---|
| Lan Chi Yaw | -- | Old Republic Title Company | |
| Lan Chi Ying | -- | Old Republic Title Company | |
| Lan Chi Yaw | $3,500,000 | Old Republic Title Company | |
| Holley David R | -- | Old Republic Title Company | |
| Sagin Richard Vito | $700,000 | Old Republic Title |
Source: Public Records
Mortgage History
We collect this data history from publicly available records. To have your information removed, we recommend requesting removal directly through your county’s website.
| Date | Status | Borrower | Loan Amount |
|---|---|---|---|
| Previous Owner | Holley David R | $2,544,463 | |
| Previous Owner | Sagin Richard Vito | $350,000 |
Source: Public Records
Tax History
| Year | Tax Paid | Tax Assessment Tax Assessment Total Assessment is a certain percentage of the fair market value that is determined by local assessors to be the total taxable value of land and additions on the property. | Land | Improvement |
|---|---|---|---|---|
| 2025 | $45,160 | $4,143,285 | $947,036 | $3,196,249 |
| 2024 | $45,160 | $4,062,045 | $928,467 | $3,133,578 |
| 2023 | $43,576 | $3,982,398 | $910,262 | $3,072,136 |
| 2022 | $42,979 | $3,904,313 | $892,414 | $3,011,899 |
| 2021 | $42,358 | $3,827,759 | $874,916 | $2,952,843 |
| 2020 | $40,760 | $3,788,511 | $865,945 | $2,922,566 |
| 2019 | $42,788 | $3,714,227 | $848,966 | $2,865,261 |
| 2018 | $41,075 | $3,641,400 | $832,320 | $2,809,080 |
| 2017 | $38,043 | $3,570,000 | $816,000 | $2,754,000 |
| 2016 | $37,368 | $3,500,000 | $800,000 | $2,700,000 |
| 2015 | $26,860 | $2,500,000 | $650,000 | $1,850,000 |
| 2014 | $29,909 | $2,783,781 | $753,721 | $2,030,060 |
Source: Public Records
Map
Nearby Homes
- 191 Lighthouse Ave Unit 2
- 191 Lighthouse Ave Unit 4
- 191 Lighthouse Ave Unit 1
- 191 Lighthouse Ave
- 191 Lighthouse Ave Unit 3
- 361 Reeside Ave
- 201 Lighthouse Ave
- 180 Hawthorne St
- 360 Reeside Ave
- 211 Lighthouse Ave
- 160 Hawthorne St
- 200 Hawthorne St
- 212 Hawthorne St
- 150 Hawthorne St
- 224 Hawthorne St
- 237 Lighthouse Ave
- 140 Hawthorne St
- 236 Hawthorne St
- 100 Hawthorne St
- 251 Lighthouse Ave Unit 249
Your Personal Tour Guide
Ask me questions while you tour the home.