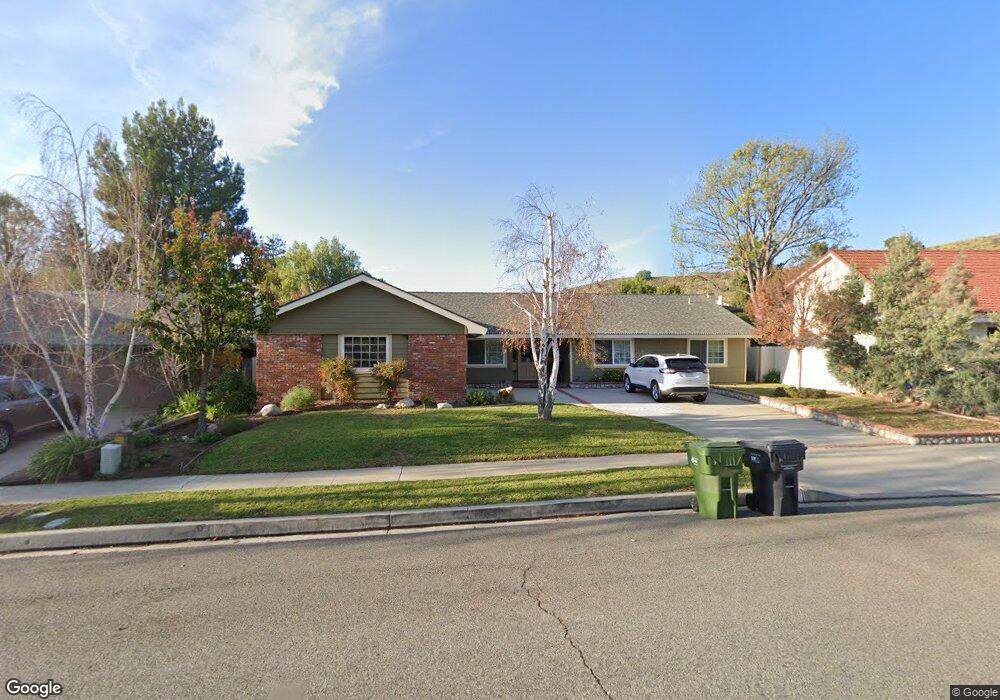
191 Lucero St Thousand Oaks, CA 91360
Estimated Value: $1,046,115 - $1,112,000
4
Beds
2
Baths
1,857
Sq Ft
$585/Sq Ft
Est. Value
About This Home
This home is located at 191 Lucero St, Thousand Oaks, CA 91360 and is currently estimated at $1,086,029, approximately $584 per square foot. 191 Lucero St is a home located in Ventura County with nearby schools including Weathersfield Elementary School, Los Cerritos Middle School, and Thousand Oaks High School.
Ownership History
Date
Name
Owned For
Owner Type
Purchase Details
Closed on
Dec 28, 2020
Sold by
Neale Richard N and Neale Jane N
Bought by
Neale Richard N and Neale Jane N
Current Estimated Value
Purchase Details
Closed on
Jun 10, 2015
Sold by
Neale Richard W and Neale Jane
Bought by
Neale Richard W and Neale Ane
Home Financials for this Owner
Home Financials are based on the most recent Mortgage that was taken out on this home.
Original Mortgage
$497,000
Outstanding Balance
$388,073
Interest Rate
3.98%
Mortgage Type
VA
Estimated Equity
$697,956
Purchase Details
Closed on
Sep 17, 2013
Sold by
Neale Jane N and Neale Richard W
Bought by
Neale Richard W and Neale Jane N
Purchase Details
Closed on
Oct 25, 2002
Sold by
Doohan Christopher and Doohan Kimberly
Bought by
Neale Richard W and Neale Jane N
Home Financials for this Owner
Home Financials are based on the most recent Mortgage that was taken out on this home.
Original Mortgage
$260,000
Interest Rate
6.06%
Create a Home Valuation Report for This Property
The Home Valuation Report is an in-depth analysis detailing your home's value as well as a comparison with similar homes in the area
Home Values in the Area
Average Home Value in this Area
Purchase History
| Date | Buyer | Sale Price | Title Company |
|---|---|---|---|
| Neale Richard N | -- | Stewart Title Of Ca Inc | |
| Neale Richard W | -- | Servicelink | |
| Neale Richard W | -- | None Available | |
| Neale Richard W | $439,000 | First Southwestern Title Co |
Source: Public Records
Mortgage History
| Date | Status | Borrower | Loan Amount |
|---|---|---|---|
| Open | Neale Richard W | $497,000 | |
| Previous Owner | Neale Richard W | $260,000 |
Source: Public Records
Tax History Compared to Growth
Tax History
| Year | Tax Paid | Tax Assessment Tax Assessment Total Assessment is a certain percentage of the fair market value that is determined by local assessors to be the total taxable value of land and additions on the property. | Land | Improvement |
|---|---|---|---|---|
| 2025 | $5,302 | $635,793 | $254,317 | $381,476 |
| 2024 | $5,302 | $623,327 | $249,330 | $373,997 |
| 2023 | $5,194 | $611,105 | $244,441 | $366,664 |
| 2022 | $5,185 | $599,123 | $239,648 | $359,475 |
| 2021 | $5,091 | $587,376 | $234,949 | $352,427 |
| 2020 | $4,699 | $581,355 | $232,541 | $348,814 |
| 2019 | $4,587 | $569,957 | $227,982 | $341,975 |
| 2018 | $4,516 | $558,782 | $223,512 | $335,270 |
| 2017 | $4,442 | $547,827 | $219,130 | $328,697 |
| 2016 | $4,409 | $537,086 | $214,834 | $322,252 |
| 2015 | $4,324 | $529,020 | $211,608 | $317,412 |
| 2014 | $4,253 | $518,660 | $207,464 | $311,196 |
Source: Public Records
Map
Nearby Homes
- 3931 Bucklin Place
- 221 Mcafee Ct
- 87 Mcafee Ct
- 73 Mcafee Ct
- 3342 Heatherglow St
- 205 Larkhill St
- 3275 Camino Calandria
- 1076 Calle Contento
- 416 Camino Dos Palos
- 71 Del Ray Cir
- 1134 Calle Pinata
- 331 Briar Bluff Cir
- 13550 Andalusia Dr
- 4850 N Moorpark Rd
- 2625 Marvella Ct
- 2947 Camino Del Zuro
- 12738 Rosedale Ct
- 212 Cedar Heights Dr
- 3901 Avenida Verano
- 12951 Sunny Ln
- 213 Lucero St
- 179 Lucero St
- 142 Magellan St
- 154 Magellan St
- 233 Lucero St
- 130 Magellan St
- 157 Lucero St
- 166 Magellan St
- 190 Lucero St
- 212 Lucero St
- 178 Lucero St
- 247 Lucero St
- 135 Lucero St
- 104 Fallen Oaks Dr
- 234 Lucero St
- 112 Fallen Oaks Dr
- 156 Lucero St
- 178 Magellan St
- 96 Fallen Oaks Dr
- 169 Magellan St