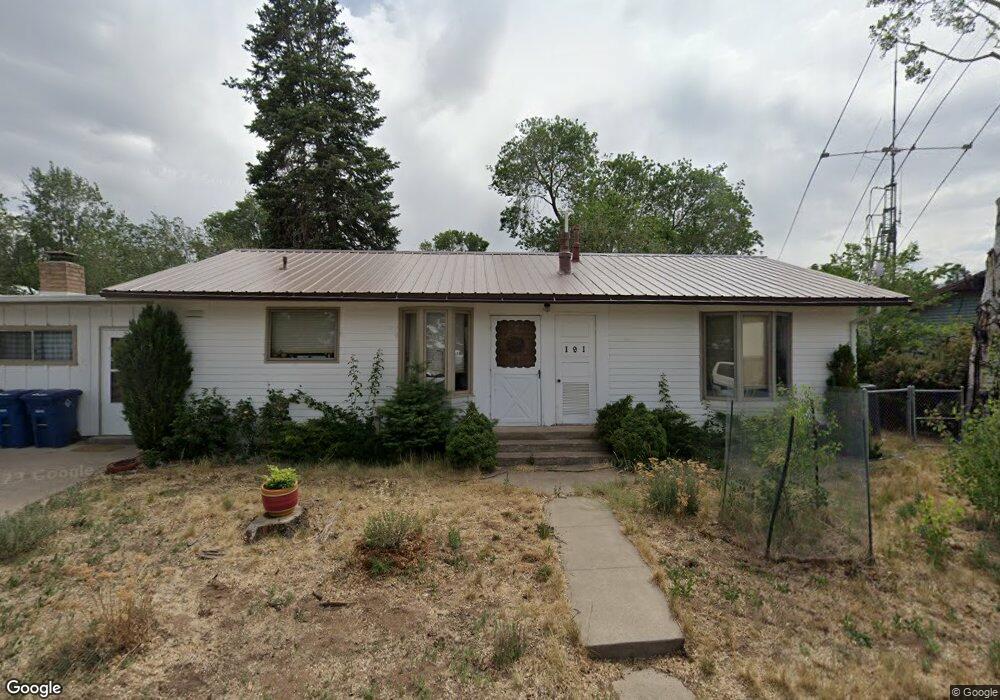
191 Manhattan Loop Los Alamos, NM 87544
Estimated Value: $428,000 - $526,048
3
Beds
1
Bath
1,437
Sq Ft
$335/Sq Ft
Est. Value
About This Home
This home is located at 191 Manhattan Loop, Los Alamos, NM 87544 and is currently estimated at $481,012, approximately $334 per square foot. 191 Manhattan Loop is a home located in Los Alamos County with nearby schools including Aspen Elementary School, Los Alamos Middle School, and Los Alamos High School.
Ownership History
Date
Name
Owned For
Owner Type
Purchase Details
Closed on
Jun 7, 2018
Sold by
Pena Maria Isela and Forestieri Alex Agustin
Bought by
Root Margaret and Baugher Travis
Current Estimated Value
Purchase Details
Closed on
Jan 12, 2017
Sold by
Pena Maria Isela
Bought by
Pena Maria Isela and Forestieri Alex Augustin
Purchase Details
Closed on
Oct 27, 2011
Sold by
Pena Maria Isela and Peters Maria I
Bought by
Pena Maria Isela
Home Financials for this Owner
Home Financials are based on the most recent Mortgage that was taken out on this home.
Original Mortgage
$153,600
Interest Rate
4.08%
Mortgage Type
New Conventional
Purchase Details
Closed on
Sep 15, 2008
Sold by
Majewski Jaroslaw P and Majewska Beata K
Bought by
Peters Maria I
Home Financials for this Owner
Home Financials are based on the most recent Mortgage that was taken out on this home.
Original Mortgage
$152,000
Interest Rate
6.54%
Mortgage Type
New Conventional
Create a Home Valuation Report for This Property
The Home Valuation Report is an in-depth analysis detailing your home's value as well as a comparison with similar homes in the area
Purchase History
| Date | Buyer | Sale Price | Title Company |
|---|---|---|---|
| Root Margaret | -- | None Available | |
| Pena Maria Isela | -- | None Available | |
| Pena Maria Isela | -- | -- | |
| Peters Maria I | -- | -- |
Source: Public Records
Mortgage History
| Date | Status | Borrower | Loan Amount |
|---|---|---|---|
| Previous Owner | Pena Maria Isela | $153,600 | |
| Previous Owner | Peters Maria I | $152,000 |
Source: Public Records
Tax History
| Year | Tax Paid | Tax Assessment Tax Assessment Total Assessment is a certain percentage of the fair market value that is determined by local assessors to be the total taxable value of land and additions on the property. | Land | Improvement |
|---|---|---|---|---|
| 2025 | $2,419 | $101,910 | $26,890 | $75,020 |
| 2024 | $2,331 | $98,940 | $26,470 | $72,470 |
| 2023 | $2,305 | $96,050 | $26,100 | $69,950 |
| 2022 | $2,253 | $93,260 | $25,700 | $67,560 |
| 2021 | $2,180 | $90,550 | $25,360 | $65,190 |
| 2020 | $2,157 | $87,910 | $25,140 | $62,770 |
| 2019 | $2,127 | $85,350 | $24,580 | $60,770 |
| 2018 | $1,403 | $55,930 | $20,150 | $35,780 |
| 2017 | $1,370 | $54,300 | $19,830 | $34,470 |
| 2016 | $1,285 | $52,720 | $19,750 | $32,970 |
| 2015 | $1,251 | $51,190 | $19,150 | $32,040 |
| 2014 | $1,164 | $51,560 | $19,150 | $32,410 |
| 2013 | $1,245 | $55,200 | $21,290 | $33,910 |
| 2011 | $1,239 | $57,490 | $21,940 | $35,550 |
Source: Public Records
Map
Nearby Homes
- 80 Canyon Rd
- 487 Myrtle St
- 1300 Iris St Unit 101
- 1303 Sage Loop
- 945 San Ildefonso Rd Unit 73
- 945 San Ildefonso Rd Unit 16
- 1015 Alamo Rd
- 1001 Oppenheimer Dr Unit 122
- 2176 La Tierra Rd
- 505 Oppenheimer Dr Unit 504
- 505 Oppenheimer Dr Unit 904
- 505 Oppenheimer Dr Unit 806
- 505 Oppenheimer Dr Unit 108
- 2861 Nickel St
- 3055 Trinity Dr Unit 421
- 1315 San Ildefonso Rd
- 881 Camino Encantado
- 0 Canyon View Rd Unit 11 13 15 17 19
- 710 Camino Encantado
- 253 San Juan St
- 149 Manhattan Loop
- 1260 2nd St
- 247 Manhattan Loop
- 1261 2nd St
- 1217 1st St
- 103 Manhattan Loop
- 190 Manhattan Loop
- 289 Manhattan Loop
- 148 Manhattan Loop
- 100 Manhattan Loop
- 1251 2nd St
- 1320 3rd St
- 1240 2nd St
- 280 Manhattan Loop
- 90 Manhattan Loop
- 89 Manhattan Loop
- 1233 2nd St
- 307 Manhattan Loop
- 1111 1st St
- 1300 3rd St
Your Personal Tour Guide
Ask me questions while you tour the home.