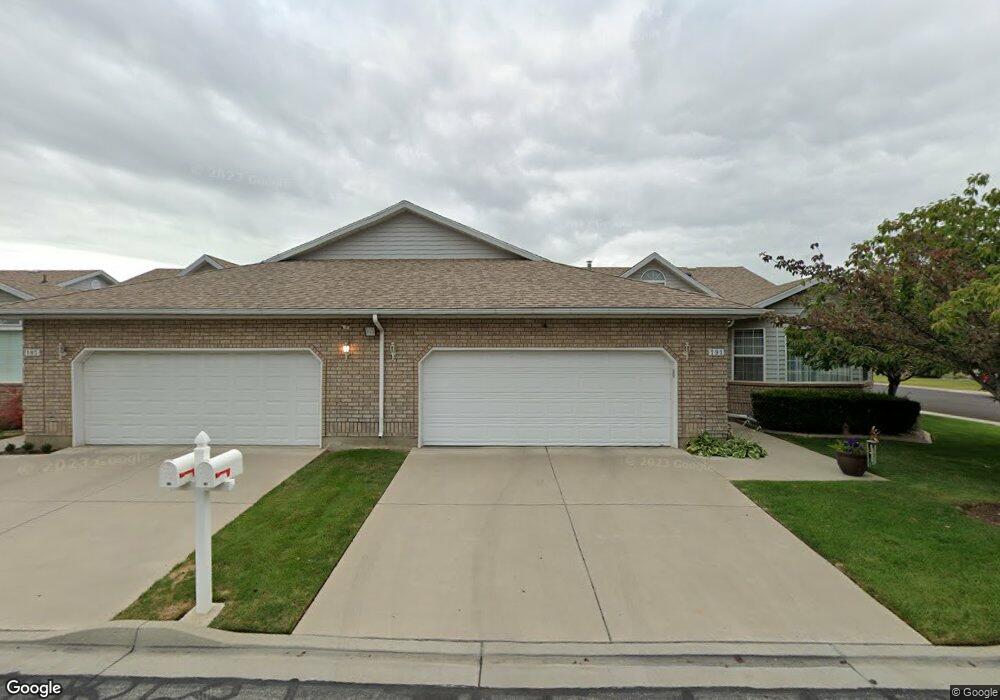
191 N 170 E Orem, UT 84057
Sharon NeighborhoodEstimated Value: $569,000 - $606,988
4
Beds
3
Baths
3,870
Sq Ft
$153/Sq Ft
Est. Value
About This Home
This home is located at 191 N 170 E, Orem, UT 84057 and is currently estimated at $591,329, approximately $152 per square foot. 191 N 170 E is a home located in Utah County with nearby schools including Cascade Elementary School, Canyon View Junior High School, and Orem High School.
Ownership History
Date
Name
Owned For
Owner Type
Purchase Details
Closed on
Jun 1, 2016
Sold by
Taylor Paul Scott and Taylor Nancy Tanner
Bought by
Taylor Paul and Taylor Nancy T
Current Estimated Value
Purchase Details
Closed on
Feb 11, 2002
Sold by
Taylor Nancy Tanner
Bought by
Taylor Paul Scott and Taylor Nancy Tanner
Purchase Details
Closed on
Oct 30, 1997
Sold by
Houston Ronald E
Bought by
Taylor Nancy T
Home Financials for this Owner
Home Financials are based on the most recent Mortgage that was taken out on this home.
Original Mortgage
$100,000
Outstanding Balance
$16,528
Interest Rate
7.36%
Estimated Equity
$574,801
Create a Home Valuation Report for This Property
The Home Valuation Report is an in-depth analysis detailing your home's value as well as a comparison with similar homes in the area
Home Values in the Area
Average Home Value in this Area
Purchase History
| Date | Buyer | Sale Price | Title Company |
|---|---|---|---|
| Taylor Paul | -- | None Available | |
| Taylor Paul Scott | -- | -- | |
| Taylor Paul Scott | -- | -- | |
| Taylor Nancy T | -- | -- |
Source: Public Records
Mortgage History
| Date | Status | Borrower | Loan Amount |
|---|---|---|---|
| Open | Taylor Nancy T | $100,000 |
Source: Public Records
Tax History
| Year | Tax Paid | Tax Assessment Tax Assessment Total Assessment is a certain percentage of the fair market value that is determined by local assessors to be the total taxable value of land and additions on the property. | Land | Improvement |
|---|---|---|---|---|
| 2025 | $2,642 | $329,670 | -- | -- |
| 2024 | $2,642 | $323,070 | $0 | $0 |
| 2023 | $2,041 | $268,180 | $0 | $0 |
| 2022 | $2,273 | $289,465 | $0 | $0 |
| 2021 | $2,141 | $412,800 | $49,500 | $363,300 |
| 2020 | $1,945 | $368,600 | $44,200 | $324,400 |
| 2019 | $1,799 | $354,500 | $46,100 | $308,400 |
| 2018 | $1,637 | $308,300 | $37,000 | $271,300 |
| 2017 | $1,558 | $157,135 | $0 | $0 |
| 2016 | $1,564 | $145,475 | $0 | $0 |
| 2015 | $1,654 | $145,475 | $0 | $0 |
| 2014 | $1,661 | $145,475 | $0 | $0 |
Source: Public Records
Map
Nearby Homes
Your Personal Tour Guide
Ask me questions while you tour the home.