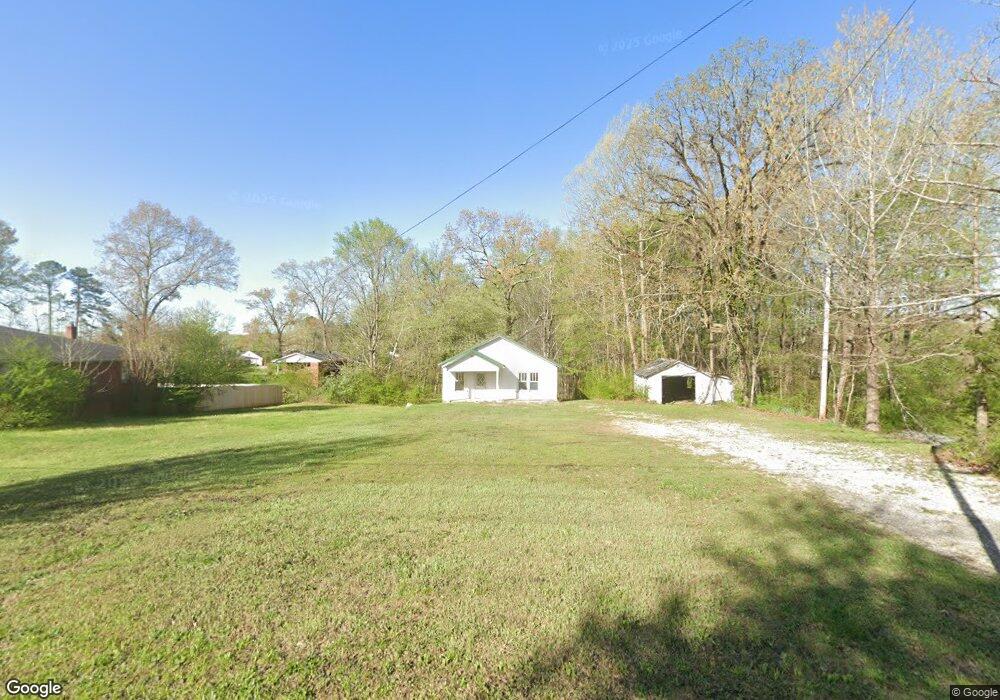
191 Washington Ave Camden, TN 38320
Estimated Value: $19,000 - $93,000
2
Beds
1
Bath
1,080
Sq Ft
$42/Sq Ft
Est. Value
About This Home
This home is located at 191 Washington Ave, Camden, TN 38320 and is currently estimated at $45,784, approximately $42 per square foot. 191 Washington Ave is a home located in Benton County with nearby schools including Camden Elementary School, Briarwood School, and Camden Junior High School.
Ownership History
Date
Name
Owned For
Owner Type
Purchase Details
Closed on
Sep 14, 2024
Sold by
Fuller Christopher Troy and Nicholson Janie M
Bought by
Anhaiser Benjamin
Current Estimated Value
Purchase Details
Closed on
Jan 12, 2021
Sold by
Nicholson Janie M
Bought by
Fuller Christopher Troy
Purchase Details
Closed on
Jul 24, 2020
Sold by
Lynch Angela Malin
Bought by
Nicholson Janie M
Purchase Details
Closed on
Jan 19, 2012
Sold by
Malin Edna J
Bought by
Malin Marion Lee Edna J and Lynch Angela Malin
Purchase Details
Closed on
May 21, 2010
Sold by
Monahan Angela Jean
Bought by
Malin Marion L
Purchase Details
Closed on
Feb 25, 1991
Bought by
Malin Marion L and Malin Velia
Purchase Details
Closed on
Jan 20, 1990
Bought by
Batchelder Blaine C
Purchase Details
Closed on
Sep 25, 1985
Bought by
Hayes Hayes R and Hayes Vera I
Create a Home Valuation Report for This Property
The Home Valuation Report is an in-depth analysis detailing your home's value as well as a comparison with similar homes in the area
Home Values in the Area
Average Home Value in this Area
Purchase History
| Date | Buyer | Sale Price | Title Company |
|---|---|---|---|
| Anhaiser Benjamin | $20,000 | None Listed On Document | |
| Anhaiser Benjamin | $20,000 | None Listed On Document | |
| Fuller Christopher Troy | -- | None Available | |
| Nicholson Janie M | $18,000 | None Available | |
| Malin Marion Lee Edna J | -- | -- | |
| Malin Marion L | -- | -- | |
| Malin Marion L | $12,000 | -- | |
| Batchelder Blaine C | $15,000 | -- | |
| Hayes Hayes R | -- | -- | |
| Malin Marion L | -- | -- |
Source: Public Records
Tax History Compared to Growth
Tax History
| Year | Tax Paid | Tax Assessment Tax Assessment Total Assessment is a certain percentage of the fair market value that is determined by local assessors to be the total taxable value of land and additions on the property. | Land | Improvement |
|---|---|---|---|---|
| 2024 | $379 | $10,350 | $3,000 | $7,350 |
| 2023 | $379 | $10,350 | $3,000 | $7,350 |
| 2022 | $379 | $10,350 | $3,000 | $7,350 |
| 2021 | $379 | $10,350 | $3,000 | $7,350 |
| 2020 | $380 | $10,350 | $3,000 | $7,350 |
| 2019 | $378 | $9,550 | $3,000 | $6,550 |
| 2018 | $378 | $9,550 | $3,000 | $6,550 |
| 2017 | $380 | $9,550 | $3,000 | $6,550 |
| 2016 | $380 | $9,625 | $3,000 | $6,625 |
| 2015 | $384 | $9,625 | $3,000 | $6,625 |
| 2014 | $338 | $9,625 | $3,000 | $6,625 |
| 2013 | $338 | $8,587 | $0 | $0 |
Source: Public Records
Map
Nearby Homes
- 1762 Washington Ave
- 154 Mcrae St
- 121 Davidson St
- 0 Forrest Ave N
- 215 Woodside St
- 136 N Forrest Ave
- 125 Washington Ave
- 121 Washington Ave
- 180 Post Oak Ave
- 119 Maple Ave
- 116 Magnolia St
- 144 Post Oak Ave
- 130 Mimosa St
- 116 N Church Ave
- 0 Higdon Ck Rd Unit RTC2993447
- 1 Maple Ave
- 111 Melton Ave
- 616 N Forrest Ave
- 107 Melton Ave
- 166 Westview St
- 189 Washington Ave
- 195 Washington Ave
- 134 Mcrae St
- 192 Washington Ave
- 197 Washington Ave
- 194 Washington Ave
- 185 Washington Ave
- 198 Washington Ave
- 200 Washington Ave
- 188 Washington Ave
- 133 Mcrae St Unit 133
- 138 Mcrae St
- 199 Washington Ave
- 183 Washington Ave
- 202 Washington Ave
- 184 Washington Ave
- 137 Mcrae St
- 137 Mcrae St Unit 137
- 102 Underwood St
- 204 Washington Ave