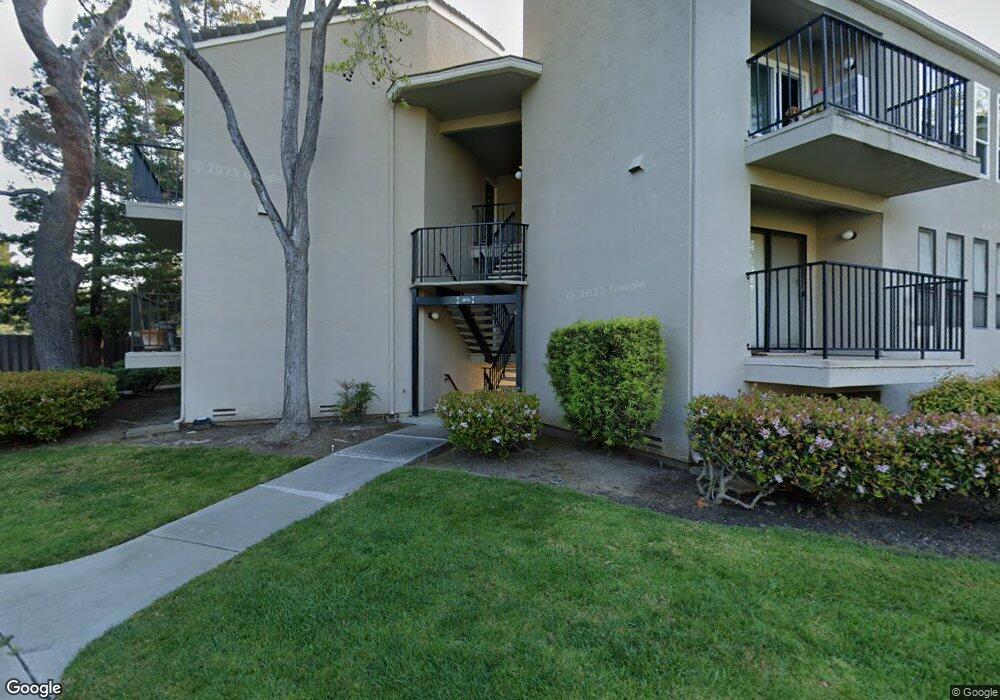
1910 Barrymore Common Unit B Fremont, CA 94538
Downtown Fremont NeighborhoodEstimated Value: $609,000 - $713,000
2
Beds
2
Baths
991
Sq Ft
$653/Sq Ft
Est. Value
About This Home
This home is located at 1910 Barrymore Common Unit B, Fremont, CA 94538 and is currently estimated at $647,155, approximately $653 per square foot. 1910 Barrymore Common Unit B is a home located in Alameda County with nearby schools including J. Haley Durham Elementary School, G.M. Walters Middle School, and John F. Kennedy High School.
Ownership History
Date
Name
Owned For
Owner Type
Purchase Details
Closed on
Jul 21, 2023
Sold by
Feng Xueyang and Feng Fei
Bought by
Feng Xuebin and Liu Feng
Current Estimated Value
Purchase Details
Closed on
Oct 17, 2019
Sold by
Conidi Carol Janet
Bought by
Feng Xueyang and Wang Fei
Home Financials for this Owner
Home Financials are based on the most recent Mortgage that was taken out on this home.
Original Mortgage
$458,400
Interest Rate
3.5%
Mortgage Type
New Conventional
Purchase Details
Closed on
Feb 7, 2002
Sold by
Remington William J and Remington Lisa A
Bought by
Dahod Ashraf M and Dahod Shamim A
Home Financials for this Owner
Home Financials are based on the most recent Mortgage that was taken out on this home.
Original Mortgage
$150,748
Interest Rate
7.13%
Mortgage Type
Purchase Money Mortgage
Purchase Details
Closed on
Apr 6, 1998
Sold by
Conidi Carol J
Bought by
Conidi Carol Janet
Create a Home Valuation Report for This Property
The Home Valuation Report is an in-depth analysis detailing your home's value as well as a comparison with similar homes in the area
Home Values in the Area
Average Home Value in this Area
Purchase History
| Date | Buyer | Sale Price | Title Company |
|---|---|---|---|
| Feng Xuebin | -- | None Listed On Document | |
| Feng Xueyang | $573,000 | Fidelity National Title Co | |
| Dahod Ashraf M | $340,000 | New Century Title Company | |
| Conidi Carol Janet | -- | -- |
Source: Public Records
Mortgage History
| Date | Status | Borrower | Loan Amount |
|---|---|---|---|
| Previous Owner | Feng Xueyang | $458,400 | |
| Previous Owner | Dahod Ashraf M | $150,748 |
Source: Public Records
Tax History Compared to Growth
Tax History
| Year | Tax Paid | Tax Assessment Tax Assessment Total Assessment is a certain percentage of the fair market value that is determined by local assessors to be the total taxable value of land and additions on the property. | Land | Improvement |
|---|---|---|---|---|
| 2025 | $8,079 | $663,000 | $198,900 | $464,100 |
| 2024 | $8,079 | $650,000 | $195,000 | $455,000 |
| 2023 | $7,467 | $602,320 | $180,696 | $421,624 |
| 2022 | $7,366 | $590,510 | $177,153 | $413,357 |
| 2021 | $7,193 | $578,935 | $173,680 | $405,255 |
| 2020 | $7,188 | $573,000 | $171,900 | $401,100 |
| 2019 | $3,196 | $234,448 | $64,675 | $169,773 |
| 2018 | $3,130 | $229,851 | $63,407 | $166,444 |
| 2017 | $3,051 | $225,345 | $62,164 | $163,181 |
| 2016 | $2,987 | $220,927 | $60,945 | $159,982 |
| 2015 | $2,934 | $217,609 | $60,030 | $157,579 |
| 2014 | $2,882 | $213,347 | $58,854 | $154,493 |
Source: Public Records
Map
Nearby Homes
- 39495 Albany Common Unit C
- 39455 Albany Common Unit V
- 39199 Guardino Dr Unit 179
- 39199 Guardino Dr Unit 371
- 39149 Guardino Dr Unit 247
- 39331 Marbella Terraza
- 3454 Dayton Common
- 3455 Gilman Common
- 952 Cherry Glen Terrace
- 38780 Tyson Ln Unit 305C
- 38697 Huntington Cir
- 976 Huntington Terrace
- 3518 Madison Common
- 3695 Stevenson Blvd Unit E206
- 3275 Capitol Ave
- 155 Branta Common
- 38623 Cherry Ln Unit 148
- 38623 Cherry Ln Unit 207
- 38623 Cherry Ln Unit 201
- 38623 Cherry Ln Unit 203
- 1910 Barrymore Common
- 1910 Barrymore Common Unit I
- 1910 Barrymore Common Unit L
- 1910 Barrymore Common Unit K
- 1910 Barrymore Common Unit M
- 1910 Barrymore Common Unit 128
- 1910 Barrymore Common Unit A
- 1910 Barrymore Common Unit C
- 1910 Barrymore Common Unit F
- 1910 Barrymore Common Unit E
- 1910 Barrymore Common Unit H
- 1910 Barrymore Common Unit G
- 1910 Barrymore Common Unit J
- 1930 Barrymore Common
- 1930 Barrymore Common Unit N
- 1930 Barrymore Common Unit P
- 1930 Barrymore Common Unit O
- 1930 Barrymore Common Unit R
- 1930 Barrymore Common Unit Q
- 1930 Barrymore Common Unit T