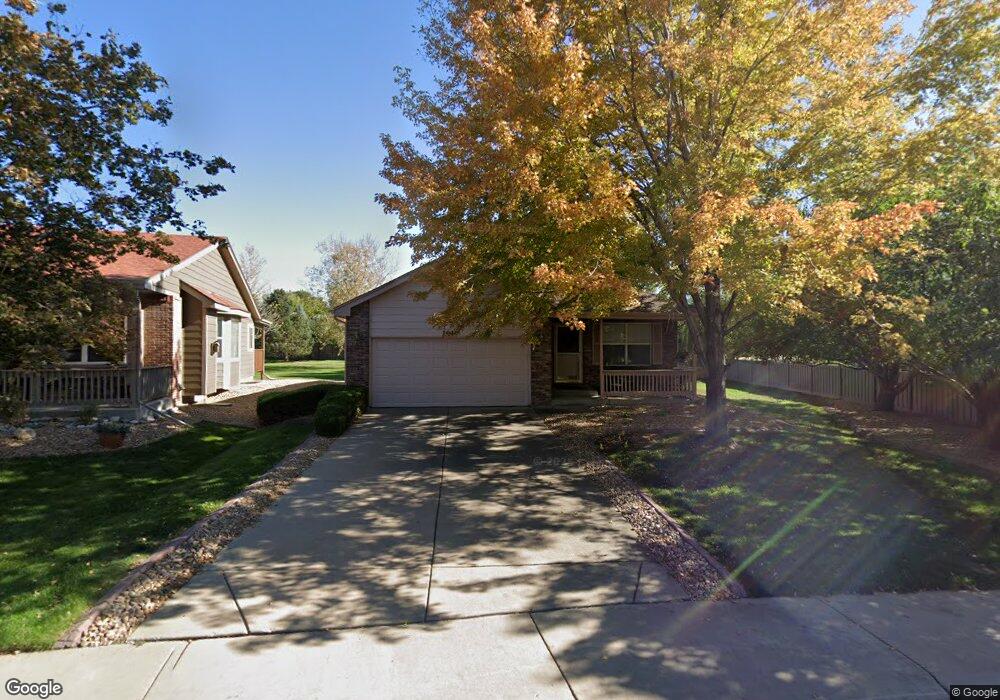
1910 E 135th Way Thornton, CO 80241
Hunters Glen NeighborhoodEstimated Value: $555,000 - $584,000
3
Beds
3
Baths
1,880
Sq Ft
$303/Sq Ft
Est. Value
About This Home
This home is located at 1910 E 135th Way, Thornton, CO 80241 and is currently estimated at $569,312, approximately $302 per square foot. 1910 E 135th Way is a home located in Adams County with nearby schools including Hunters Glen Elementary School, Century Middle School, and Mountain Range High School.
Ownership History
Date
Name
Owned For
Owner Type
Purchase Details
Closed on
Oct 29, 2020
Sold by
Farquhar Mamie R and Lykens Ginger Farquhar
Bought by
White Karen S
Current Estimated Value
Home Financials for this Owner
Home Financials are based on the most recent Mortgage that was taken out on this home.
Original Mortgage
$422,750
Outstanding Balance
$376,187
Interest Rate
2.8%
Mortgage Type
New Conventional
Estimated Equity
$193,125
Purchase Details
Closed on
Jan 28, 2015
Sold by
Farquhar Mamie R
Bought by
Farquhar Farquhar Mamie R Mamie R and Farquhar Lykens Ginger
Purchase Details
Closed on
Mar 18, 1998
Sold by
The Cottages At Hunters Glen Llc
Bought by
Farquhar Vernus L and Farquhar Mamie R
Home Financials for this Owner
Home Financials are based on the most recent Mortgage that was taken out on this home.
Original Mortgage
$49,000
Interest Rate
7.12%
Create a Home Valuation Report for This Property
The Home Valuation Report is an in-depth analysis detailing your home's value as well as a comparison with similar homes in the area
Home Values in the Area
Average Home Value in this Area
Purchase History
| Date | Buyer | Sale Price | Title Company |
|---|---|---|---|
| White Karen S | $445,000 | Unified Title Company | |
| Farquhar Farquhar Mamie R Mamie R | -- | None Available | |
| Farquhar Vernus L | $185,000 | -- |
Source: Public Records
Mortgage History
| Date | Status | Borrower | Loan Amount |
|---|---|---|---|
| Open | White Karen S | $422,750 | |
| Previous Owner | Farquhar Vernus L | $49,000 |
Source: Public Records
Tax History Compared to Growth
Tax History
| Year | Tax Paid | Tax Assessment Tax Assessment Total Assessment is a certain percentage of the fair market value that is determined by local assessors to be the total taxable value of land and additions on the property. | Land | Improvement |
|---|---|---|---|---|
| 2024 | $3,782 | $35,260 | $6,630 | $28,630 |
| 2023 | $3,743 | $40,250 | $6,970 | $33,280 |
| 2022 | $3,260 | $28,650 | $7,160 | $21,490 |
| 2021 | $3,260 | $28,650 | $7,160 | $21,490 |
| 2020 | $2,462 | $29,220 | $7,360 | $21,860 |
| 2019 | $2,467 | $29,220 | $7,360 | $21,860 |
| 2018 | $2,049 | $25,010 | $7,490 | $17,520 |
| 2017 | $1,863 | $25,010 | $7,490 | $17,520 |
| 2016 | $1,587 | $22,730 | $4,300 | $18,430 |
| 2015 | $1,585 | $14,770 | $2,790 | $11,980 |
| 2014 | $1,389 | $12,040 | $2,300 | $9,740 |
Source: Public Records
Map
Nearby Homes
- 13398 Race St
- 1282 E 135th Place
- 13540 Detroit St
- 3022 E 137th Place
- 2746 E 132nd Place
- 2788 E 132nd Cir
- 13748 Downing St
- 1089 E 131st Dr
- 978 E 132nd Dr
- 2691 E 132nd Ave
- 1162 E 130th Ave Unit B
- 2275 E 129th Ave
- 12931 Lafayette St Unit G
- 12905 Lafayette St Unit H
- 12829 Claude Place
- 12811 Josephine Ct
- 13758 Cook St
- 13845 Adams Cir
- 13242 Pearl Cir
- 13963 Cook St
- 1930 E 135th Way
- 13508 Vine St
- 1940 E 135th Way
- 13504 Vine St
- 1895 E 135th Ave
- 13511 High Cir
- 1945 Gaylord Place
- 1905 E 135th Way
- 13500 Vine St
- 1960 E 135th Way
- 1965 Gaylord Place
- 1885 E 135th Ave
- 13510 High Cir
- 1910 Gaylord Place
- 1915 E 135th Way
- 1970 E 135th Way
- 13496 Vine St
- 1875 E 135th Ave
- 1975 Gaylord Place
- 13485 Vine St