1910 Elm Cir West Des Moines, IA 50265
Estimated Value: $330,000 - $374,000
2
Beds
3
Baths
1,776
Sq Ft
$197/Sq Ft
Est. Value
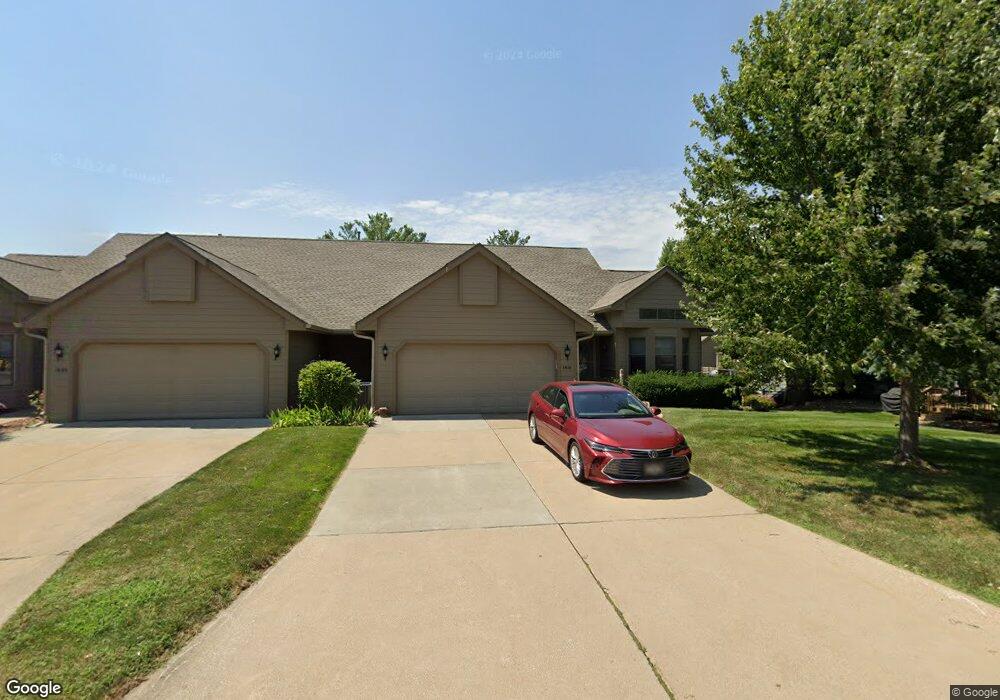
About This Home
This home is located at 1910 Elm Cir, West Des Moines, IA 50265 and is currently estimated at $350,310, approximately $197 per square foot. 1910 Elm Cir is a home located in Polk County with nearby schools including Fairmeadows Elementary School, Stilwell Junior High School, and Valley Southwoods Freshman High School.
Ownership History
Date
Name
Owned For
Owner Type
Purchase Details
Closed on
Jul 2, 2024
Sold by
Baker Vicki D
Bought by
Winn Joseph and Winn Sherrie
Current Estimated Value
Purchase Details
Closed on
Jun 1, 2007
Sold by
Wells Fargo Bank Iowa Na and Albrecht Barbara J
Bought by
Baker Russel D and Baker Vicki D
Purchase Details
Closed on
May 1, 2001
Sold by
Rnp Ltd
Bought by
Roach Danny G and Roach Joann
Create a Home Valuation Report for This Property
The Home Valuation Report is an in-depth analysis detailing your home's value as well as a comparison with similar homes in the area
Home Values in the Area
Average Home Value in this Area
Purchase History
| Date | Buyer | Sale Price | Title Company |
|---|---|---|---|
| Winn Joseph | $350,000 | None Listed On Document | |
| Baker Russel D | $249,500 | None Available | |
| Roach Danny G | $129,500 | -- |
Source: Public Records
Tax History Compared to Growth
Tax History
| Year | Tax Paid | Tax Assessment Tax Assessment Total Assessment is a certain percentage of the fair market value that is determined by local assessors to be the total taxable value of land and additions on the property. | Land | Improvement |
|---|---|---|---|---|
| 2025 | $4,572 | $341,000 | $39,800 | $301,200 |
| 2024 | $4,572 | $305,900 | $35,200 | $270,700 |
| 2023 | $4,632 | $305,900 | $35,200 | $270,700 |
| 2022 | $4,576 | $248,800 | $29,600 | $219,200 |
| 2021 | $4,776 | $248,800 | $29,600 | $219,200 |
| 2020 | $4,700 | $246,700 | $31,100 | $215,600 |
| 2019 | $4,418 | $246,700 | $31,100 | $215,600 |
| 2018 | $4,424 | $224,200 | $30,000 | $194,200 |
| 2017 | $4,150 | $224,200 | $30,000 | $194,200 |
| 2016 | $4,054 | $204,800 | $29,300 | $175,500 |
| 2015 | $4,054 | $204,800 | $29,300 | $175,500 |
| 2014 | $3,680 | $184,700 | $32,500 | $152,200 |
Source: Public Records
Map
Nearby Homes