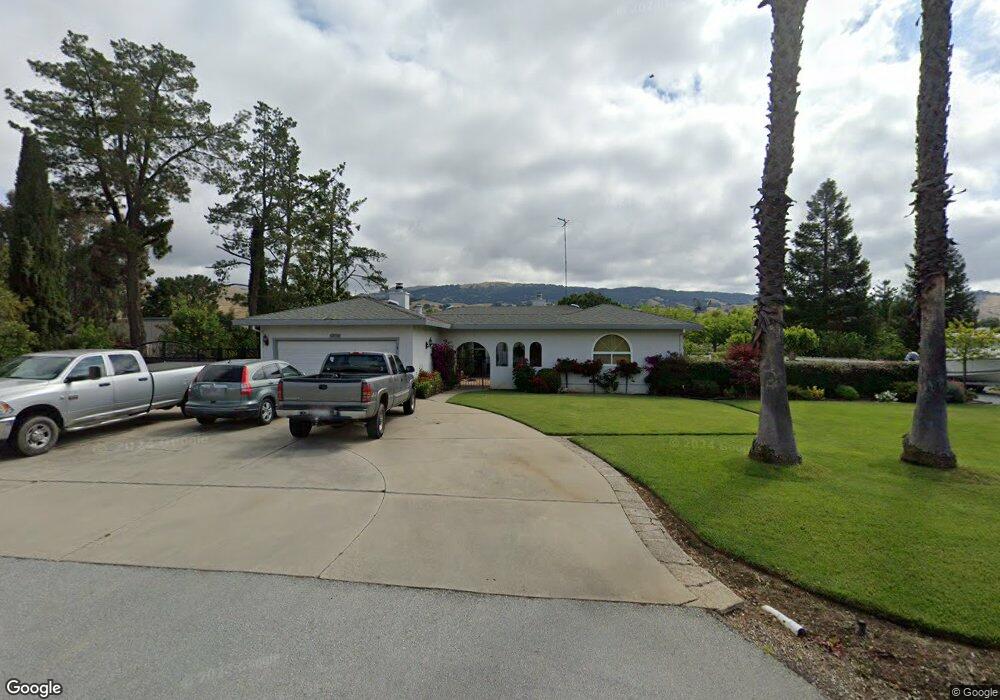
1910 Riedel Ct San Martin, CA 95046
Estimated Value: $1,431,308 - $1,772,000
3
Beds
3
Baths
1,812
Sq Ft
$872/Sq Ft
Est. Value
About This Home
This home is located at 1910 Riedel Ct, San Martin, CA 95046 and is currently estimated at $1,580,077, approximately $872 per square foot. 1910 Riedel Ct is a home located in Santa Clara County with nearby schools including San Martin/Gwinn Environmental Science Academy, Britton Middle School, and Live Oak High School.
Ownership History
Date
Name
Owned For
Owner Type
Purchase Details
Closed on
Nov 2, 2005
Sold by
Lamb Stanford H and Lamb Sonya D
Bought by
Lamb Stanford H and Lamb Sonya D
Current Estimated Value
Home Financials for this Owner
Home Financials are based on the most recent Mortgage that was taken out on this home.
Original Mortgage
$1,000,000
Outstanding Balance
$370,059
Interest Rate
1%
Mortgage Type
Negative Amortization
Estimated Equity
$1,210,018
Purchase Details
Closed on
Sep 26, 2005
Sold by
Kooker Lawrence D and Chynoweth Laura L
Bought by
Lamb Stanford H and Lamb Sonya D
Home Financials for this Owner
Home Financials are based on the most recent Mortgage that was taken out on this home.
Original Mortgage
$1,000,000
Outstanding Balance
$370,059
Interest Rate
1%
Mortgage Type
Negative Amortization
Estimated Equity
$1,210,018
Create a Home Valuation Report for This Property
The Home Valuation Report is an in-depth analysis detailing your home's value as well as a comparison with similar homes in the area
Home Values in the Area
Average Home Value in this Area
Purchase History
| Date | Buyer | Sale Price | Title Company |
|---|---|---|---|
| Lamb Stanford H | -- | Alliance Title Company | |
| Lamb Stanford H | $1,300,000 | Alliance Title Company |
Source: Public Records
Mortgage History
| Date | Status | Borrower | Loan Amount |
|---|---|---|---|
| Open | Lamb Stanford H | $1,000,000 |
Source: Public Records
Tax History Compared to Growth
Tax History
| Year | Tax Paid | Tax Assessment Tax Assessment Total Assessment is a certain percentage of the fair market value that is determined by local assessors to be the total taxable value of land and additions on the property. | Land | Improvement |
|---|---|---|---|---|
| 2025 | $2,189 | $181,046 | $75,242 | $105,804 |
| 2024 | $2,189 | $177,497 | $73,767 | $103,730 |
| 2023 | $2,161 | $174,018 | $72,321 | $101,697 |
| 2022 | $2,123 | $170,606 | $70,903 | $99,703 |
| 2021 | $2,070 | $167,262 | $69,513 | $97,749 |
| 2020 | $2,022 | $165,548 | $68,801 | $96,747 |
| 2019 | $2,076 | $162,302 | $67,452 | $94,850 |
| 2018 | $2,080 | $159,121 | $66,130 | $92,991 |
| 2017 | $2,060 | $156,002 | $64,834 | $91,168 |
| 2016 | $1,926 | $152,944 | $63,563 | $89,381 |
| 2015 | $1,905 | $150,648 | $62,609 | $88,039 |
| 2014 | $1,911 | $147,698 | $61,383 | $86,315 |
Source: Public Records
Map
Nearby Homes
- 12467 Creekview Ct
- 2115 Gwinn Ave
- 1925 Church Ave
- 12550 Center Ave
- 11840 Foothill Ave
- 13035 Center Ave
- 10980 New Ave
- 905 E San Martin Ave
- 13755 Columbet Ave
- 13640 Sycamore Ave
- 13705 Sycamore Ave
- 145 Masten Ave
- 2525 Bridle Path Dr
- 310 Lena Ave
- 13690 Murphy Ave #E
- 2055 Rucker Ave
- 0 W San Martin Ave
- 30 Chester Ave
- 12320 Highland Estates Ln
- 0 Llagas Ave Unit ML82019140
- 1920 Riedel Ct
- 1900 Riedel Ct
- 1935 Giampoli Dr
- 2000 Giampoli Dr
- 1975 Giampoli Dr
- 2010 Giampoli Dr
- 12475 Creekview Ct
- 2005 Giampoli Dr
- 2020 Giampoli Dr
- 1990 Gwinn Ave
- 2020 Giampaoli Dr
- 2030 Gwinn Ave
- 12496 Creekview Ct
- 12468 Creekview Ct
- 12474 Creekview Ct
- 12482 Creekview Ct
- 12510 Foothill Ave
- 12540 Foothill Ave
- 12400 Foothill Ave
- 2085 Giampoli Dr