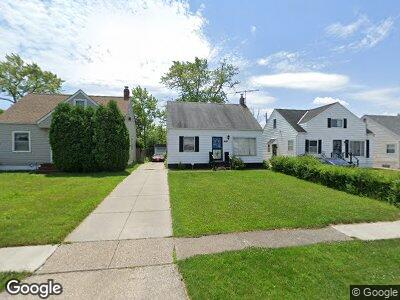
19106 Fairway Ave Maple Heights, OH 44137
Estimated Value: $98,717 - $141,000
3
Beds
1
Bath
910
Sq Ft
$123/Sq Ft
Est. Value
About This Home
This home is located at 19106 Fairway Ave, Maple Heights, OH 44137 and is currently estimated at $112,179, approximately $123 per square foot. 19106 Fairway Ave is a home located in Cuyahoga County with nearby schools including Abraham Lincoln Elementary School, Rockside/ J.F. Kennedy School, and Barack Obama School.
Ownership History
Date
Name
Owned For
Owner Type
Purchase Details
Closed on
Feb 15, 2002
Sold by
Colbert Priscilla
Bought by
Colbert Steven L and Colbert Priscilla
Current Estimated Value
Home Financials for this Owner
Home Financials are based on the most recent Mortgage that was taken out on this home.
Original Mortgage
$56,000
Outstanding Balance
$24,922
Interest Rate
7.14%
Estimated Equity
$76,891
Purchase Details
Closed on
Jul 16, 2001
Sold by
Hart Gerald and Hart Deborah
Bought by
Colbert Priscilla
Purchase Details
Closed on
Sep 28, 2000
Sold by
Hart William and Hart Legertha
Bought by
Hart Legertha
Purchase Details
Closed on
Oct 19, 1987
Sold by
Mach Richard J
Bought by
Hart William
Purchase Details
Closed on
Oct 3, 1977
Sold by
Marino Grace
Bought by
Mach Richard J
Purchase Details
Closed on
Jan 1, 1975
Bought by
Marino Grace
Create a Home Valuation Report for This Property
The Home Valuation Report is an in-depth analysis detailing your home's value as well as a comparison with similar homes in the area
Home Values in the Area
Average Home Value in this Area
Purchase History
| Date | Buyer | Sale Price | Title Company |
|---|---|---|---|
| Colbert Steven L | -- | Competitive Title | |
| Colbert Priscilla | -- | -- | |
| Colbert Priscilla | -- | -- | |
| Colbert Priscilla | -- | -- | |
| Colbert Priscilla | -- | -- | |
| Colbert Priscilla | -- | -- | |
| Hart William | $44,200 | -- | |
| Mach Richard J | $27,000 | -- | |
| Marino Grace | -- | -- |
Source: Public Records
Mortgage History
| Date | Status | Borrower | Loan Amount |
|---|---|---|---|
| Open | Colbert Steven L | $56,000 |
Source: Public Records
Tax History Compared to Growth
Tax History
| Year | Tax Paid | Tax Assessment Tax Assessment Total Assessment is a certain percentage of the fair market value that is determined by local assessors to be the total taxable value of land and additions on the property. | Land | Improvement |
|---|---|---|---|---|
| 2024 | $3,032 | $32,515 | $6,720 | $25,795 |
| 2023 | $1,974 | $17,360 | $4,060 | $13,300 |
| 2022 | $1,967 | $17,360 | $4,060 | $13,300 |
| 2021 | $2,093 | $17,360 | $4,060 | $13,300 |
| 2020 | $1,800 | $13,160 | $3,080 | $10,080 |
| 2019 | $1,789 | $37,600 | $8,800 | $28,800 |
| 2018 | $1,779 | $13,160 | $3,080 | $10,080 |
| 2017 | $1,694 | $12,110 | $2,870 | $9,240 |
| 2016 | $1,639 | $12,110 | $2,870 | $9,240 |
| 2015 | $1,628 | $12,110 | $2,870 | $9,240 |
| 2014 | $1,628 | $13,300 | $3,150 | $10,150 |
Source: Public Records
Map
Nearby Homes
- 5141 Camden Rd
- 19605 Fairway Ave
- 19505 Preston Rd
- 5151 Erwin St
- 19315 Libby Rd
- 5131 Arch St
- 19802 Mountville Dr
- 5150 Arch St
- 5031 Cato St
- 19288 Stockton Ave
- 5224 Arch St
- 18230 Libby Rd
- 5055 Thomas St
- 5041 Thomas St
- 18311 Highland Dr
- 5175 Thomas St
- 19816 Stockton Ave
- 5103 Philip Ave
- 18605 Maple Heights Blvd
- 20503 Mountville Dr
- 19106 Fairway Ave
- 19102 Fairway Ave
- 19110 Fairway Ave
- 19018 Fairway Ave
- 19114 Fairway Ave
- 19014 Fairway Ave
- 19107 Longview Ave
- 19111 Longview Ave
- 19118 Fairway Ave
- 19103 Longview Ave
- 19115 Longview Ave
- 19010 Fairway Ave
- 19019 Longview Ave
- 19119 Longview Ave
- 19107 Fairway Ave
- 19103 Fairway Ave
- 19111 Fairway Ave
- 19019 Fairway Ave
- 19115 Fairway Ave
- 19015 Longview Ave