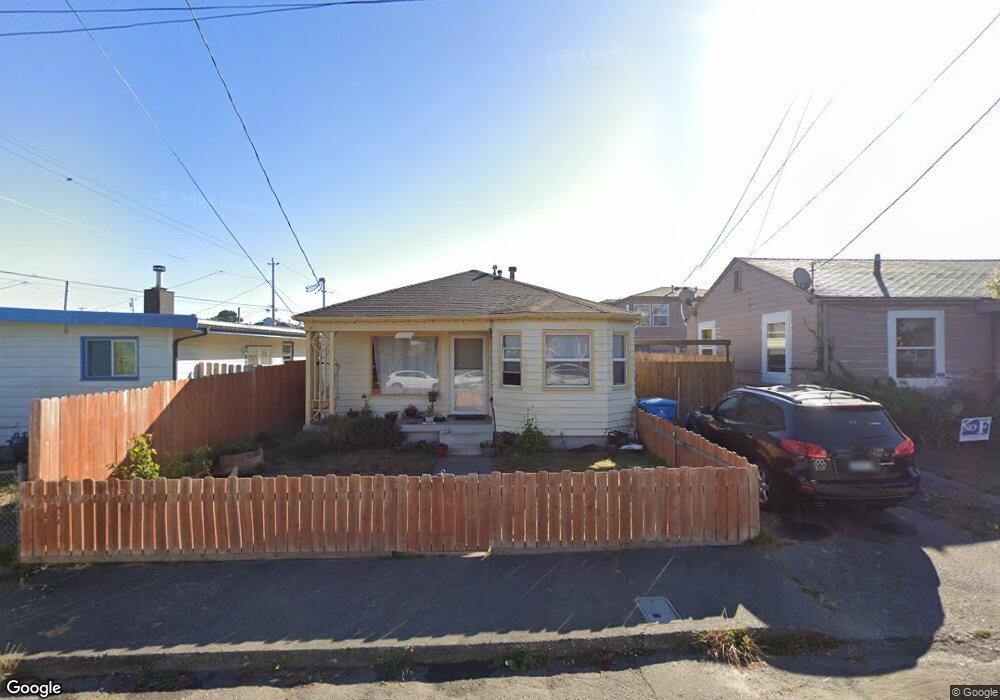
1911 A St Eureka, CA 95501
Fairfield NeighborhoodEstimated Value: $241,000 - $291,000
2
Beds
1
Bath
941
Sq Ft
$289/Sq Ft
Est. Value
About This Home
This home is located at 1911 A St, Eureka, CA 95501 and is currently estimated at $272,166, approximately $289 per square foot. 1911 A St is a home located in Humboldt County with nearby schools including Grant Elementary School, Winship Middle School, and Eureka Senior High School.
Ownership History
Date
Name
Owned For
Owner Type
Purchase Details
Closed on
May 3, 2019
Sold by
Cloud Investment Capital Llc
Bought by
Joe Wixson Revocable Trust
Current Estimated Value
Purchase Details
Closed on
May 2, 2019
Sold by
Cloud Investment Capital Llc
Bought by
Joe Wixson Revocable Trust
Purchase Details
Closed on
Mar 25, 2014
Sold by
Macy Arthur
Bought by
Macy Arthur and Arthur Macy Jr Revocable Trust
Create a Home Valuation Report for This Property
The Home Valuation Report is an in-depth analysis detailing your home's value as well as a comparison with similar homes in the area
Home Values in the Area
Average Home Value in this Area
Purchase History
| Date | Buyer | Sale Price | Title Company |
|---|---|---|---|
| Joe Wixson Revocable Trust | $160,000 | Humboldt Land Title | |
| Cloud Investment Capital Llc | $145,000 | Humboldt Land Title | |
| Joe Wixson Revocable Trust | $160,000 | Humboldt Land Title | |
| Cloud Investment Capital Llc | $145,000 | Humboldt Land Title | |
| Macy Arthur | -- | None Available |
Source: Public Records
Tax History
| Year | Tax Paid | Tax Assessment Tax Assessment Total Assessment is a certain percentage of the fair market value that is determined by local assessors to be the total taxable value of land and additions on the property. | Land | Improvement |
|---|---|---|---|---|
| 2025 | $2,353 | $235,967 | $129,890 | $106,077 |
| 2024 | $2,353 | $231,342 | $127,344 | $103,998 |
| 2023 | $2,319 | $226,807 | $124,848 | $101,959 |
| 2022 | $2,406 | $222,360 | $122,400 | $99,960 |
| 2021 | $2,251 | $218,000 | $120,000 | $98,000 |
| 2020 | $1,746 | $163,200 | $102,000 | $61,200 |
| 2019 | $1,296 | $121,245 | $56,580 | $64,665 |
| 2018 | $1,277 | $118,869 | $55,471 | $63,398 |
| 2017 | $1,270 | $116,539 | $54,384 | $62,155 |
| 2016 | $1,271 | $114,255 | $53,318 | $60,937 |
| 2015 | $1,259 | $112,540 | $52,518 | $60,022 |
| 2014 | $1,177 | $110,337 | $51,490 | $58,847 |
Source: Public Records
Map
Nearby Homes
Your Personal Tour Guide
Ask me questions while you tour the home.