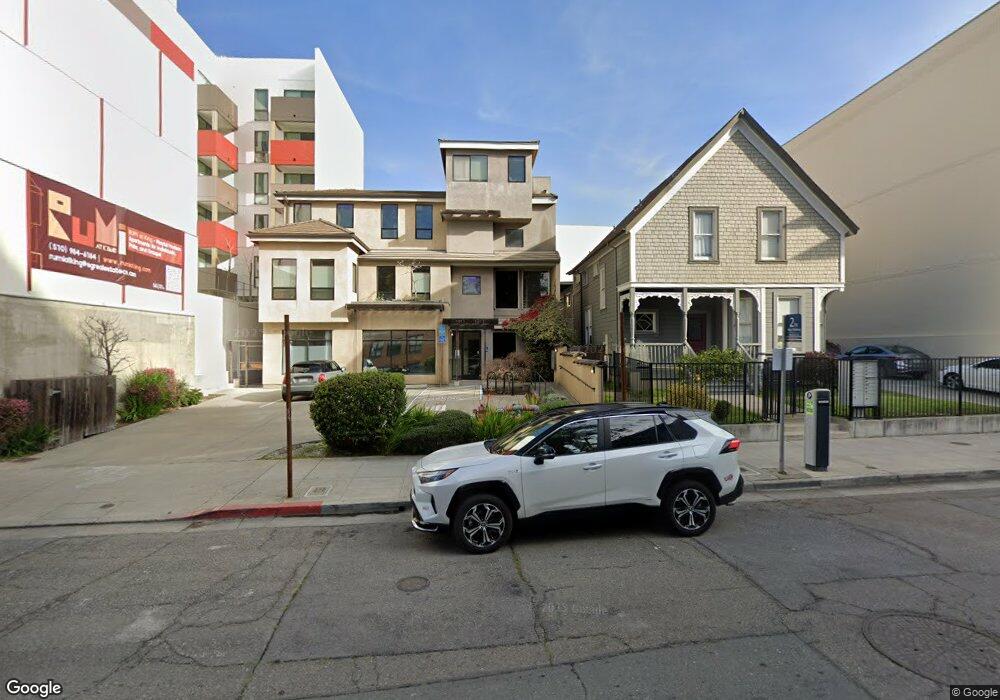
1911 Addison St Berkeley, CA 94704
Downtown Berkeley NeighborhoodEstimated Value: $2,272,345
Studio
3
Baths
6,895
Sq Ft
$330/Sq Ft
Est. Value
About This Home
This home is located at 1911 Addison St, Berkeley, CA 94704 and is currently estimated at $2,272,345, approximately $329 per square foot. 1911 Addison St is a home located in Alameda County with nearby schools including Washington Elementary School, Berkeley Arts Magnet at Whittier School, and Oxford Elementary School.
Ownership History
Date
Name
Owned For
Owner Type
Purchase Details
Closed on
Jul 26, 2012
Sold by
Korn Alexander D and Alexander D Korn Trust
Bought by
Vedensky Properties Llc
Current Estimated Value
Purchase Details
Closed on
Dec 19, 2008
Sold by
Asians For Job Opportunities In The Bay
Bought by
Korn Alexander D
Create a Home Valuation Report for This Property
The Home Valuation Report is an in-depth analysis detailing your home's value as well as a comparison with similar homes in the area
Home Values in the Area
Average Home Value in this Area
Purchase History
| Date | Buyer | Sale Price | Title Company |
|---|---|---|---|
| Vedensky Properties Llc | -- | None Available | |
| Korn Alexander D | -- | None Available | |
| Korn Alexander D | $905,000 | Chicago Title Company |
Source: Public Records
Tax History
| Year | Tax Paid | Tax Assessment Tax Assessment Total Assessment is a certain percentage of the fair market value that is determined by local assessors to be the total taxable value of land and additions on the property. | Land | Improvement |
|---|---|---|---|---|
| 2025 | $39,569 | $1,607,320 | $547,259 | $1,060,061 |
| 2024 | $39,569 | $1,575,814 | $536,532 | $1,039,282 |
| 2023 | $38,569 | $1,544,923 | $526,014 | $1,018,909 |
| 2022 | $37,581 | $1,514,638 | $515,703 | $998,935 |
| 2021 | $37,356 | $1,484,942 | $505,592 | $979,350 |
| 2020 | $34,702 | $1,469,726 | $500,412 | $969,314 |
| 2019 | $33,063 | $1,440,917 | $490,603 | $950,314 |
| 2018 | $32,366 | $1,412,671 | $480,985 | $931,686 |
| 2017 | $31,233 | $1,384,975 | $471,554 | $913,421 |
| 2016 | $31,214 | $1,357,825 | $462,310 | $895,515 |
| 2015 | $30,513 | $1,337,440 | $455,370 | $882,070 |
| 2014 | $30,021 | $1,311,250 | $446,454 | $864,796 |
Source: Public Records
Map
Nearby Homes
- 2112 Mckinley Ave Unit D
- 2218 -2222 Grant St
- 1625 Martin Luther King jr Way
- 2118 California St
- 1609 Bonita Ave Unit 5
- 1610 Milvia St
- 1578 Allston Way
- 1808 Cedar St
- 1682 Oxford St
- 1813 Sacramento St
- 1739 Spruce St
- 2201 Virginia St Unit 2
- 1645 Dwight Way
- 2018 Blake St
- 1815 Vine St
- 1411 Hearst Ave Unit 2
- 1901 Parker St Unit 3
- 2340 Virginia St
- 1425 Martin Luther King jr Way
- 1519 Oxford St Unit E
- 1915 Addison St
- 2099 Martin Luther King Junior Way
- 2033 Martin Luther King jr Way
- 2070 Martin Luther King Junior Way Unit 2
- 2054 Martin Luther King jr Way
- 2070 Martin Luther King
- 2070 Martin Luther King jr Way
- 1950 University Ave
- 0 University Ave
- 1845 Addison St
- 1950 Addison St
- 1935 Addison St
- 1841 Addison St
- 1933 Addison St
- 1401 E
- 0 Bonita Ave
- 1837 Addison St
- 1833 Addison St
- 1901 University Ave
- 1827 Addison St
Your Personal Tour Guide
Ask me questions while you tour the home.