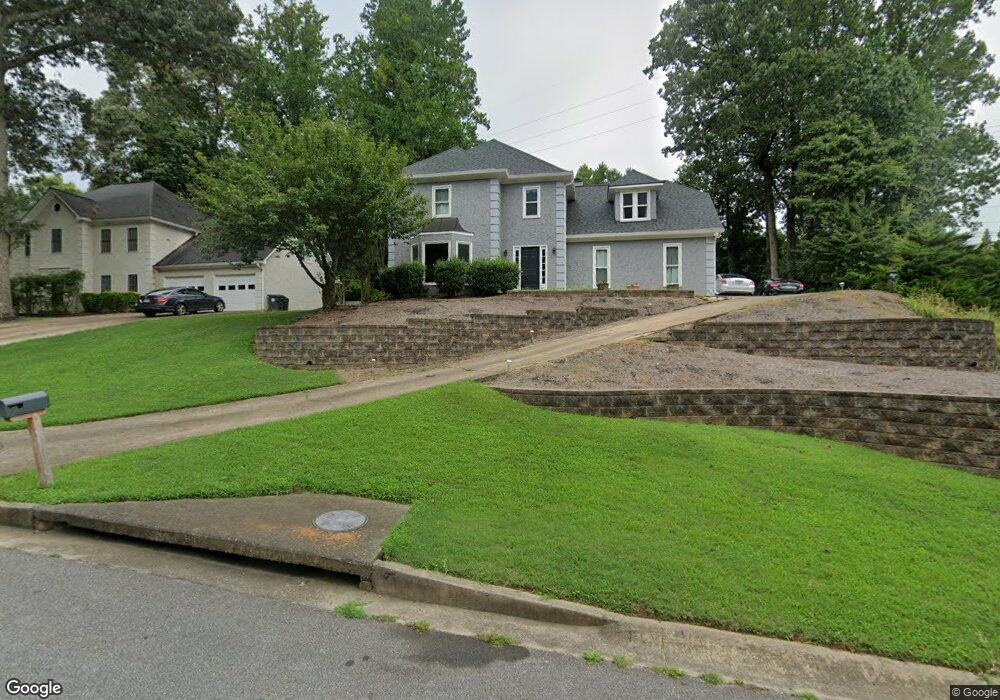
1911 Bonaventure Way Marietta, GA 30068
East Cobb NeighborhoodEstimated Value: $541,000 - $621,147
4
Beds
3
Baths
2,323
Sq Ft
$258/Sq Ft
Est. Value
About This Home
This home is located at 1911 Bonaventure Way, Marietta, GA 30068 and is currently estimated at $599,287, approximately $257 per square foot. 1911 Bonaventure Way is a home located in Cobb County with nearby schools including Timber Ridge Elementary School, Dickerson Middle School, and Walton High School.
Ownership History
Date
Name
Owned For
Owner Type
Purchase Details
Closed on
Sep 15, 2020
Sold by
Carswell Shirley
Bought by
Carswell Charles Edward and Carswell Shirley
Current Estimated Value
Home Financials for this Owner
Home Financials are based on the most recent Mortgage that was taken out on this home.
Original Mortgage
$200,000
Outstanding Balance
$105,317
Interest Rate
2.8%
Mortgage Type
New Conventional
Estimated Equity
$493,970
Purchase Details
Closed on
Sep 2, 2010
Sold by
Yelton William A
Bought by
Carswell Shirley
Home Financials for this Owner
Home Financials are based on the most recent Mortgage that was taken out on this home.
Original Mortgage
$191,915
Interest Rate
4.87%
Mortgage Type
FHA
Purchase Details
Closed on
Apr 28, 1994
Sold by
Bussard Jack
Bought by
Yelton William A
Home Financials for this Owner
Home Financials are based on the most recent Mortgage that was taken out on this home.
Original Mortgage
$121,050
Interest Rate
7.81%
Create a Home Valuation Report for This Property
The Home Valuation Report is an in-depth analysis detailing your home's value as well as a comparison with similar homes in the area
Home Values in the Area
Average Home Value in this Area
Purchase History
| Date | Buyer | Sale Price | Title Company |
|---|---|---|---|
| Carswell Charles Edward | -- | Accommodation | |
| Carswell Shirley | $194,500 | -- | |
| Yelton William A | $134,900 | -- |
Source: Public Records
Mortgage History
| Date | Status | Borrower | Loan Amount |
|---|---|---|---|
| Open | Carswell Charles Edward | $200,000 | |
| Closed | Carswell Shirley | $191,915 | |
| Previous Owner | Yelton William A | $121,050 |
Source: Public Records
Tax History Compared to Growth
Tax History
| Year | Tax Paid | Tax Assessment Tax Assessment Total Assessment is a certain percentage of the fair market value that is determined by local assessors to be the total taxable value of land and additions on the property. | Land | Improvement |
|---|---|---|---|---|
| 2025 | $4,219 | $169,508 | $40,000 | $129,508 |
| 2024 | $4,223 | $169,508 | $40,000 | $129,508 |
| 2023 | $3,680 | $169,508 | $40,000 | $129,508 |
| 2022 | $4,254 | $169,508 | $40,000 | $129,508 |
| 2021 | $4,060 | $160,648 | $38,000 | $122,648 |
| 2020 | $4,060 | $160,648 | $38,000 | $122,648 |
| 2019 | $4,060 | $160,648 | $38,000 | $122,648 |
| 2018 | $4,060 | $160,648 | $38,000 | $122,648 |
| 2017 | $2,939 | $115,628 | $32,000 | $83,628 |
| 2016 | $2,468 | $94,748 | $26,000 | $68,748 |
| 2015 | $2,531 | $94,748 | $26,000 | $68,748 |
| 2014 | $2,049 | $77,800 | $0 | $0 |
Source: Public Records
Map
Nearby Homes
- 1961 Fields Pond Dr
- 1804 Shelburne Ridge
- 4789 Waterhaven Bend
- 1929 Fields Pond Glen
- 4780 Waterhaven Bend
- 2066 Old Forge Way
- 4804 Dalhousie Place NE
- 5122 Timber Ridge Rd
- 5140 Timber Ridge Rd
- 5150 Timber Ridge Rd
- 2212 Heritage Trace View
- 4599 Lasalle Ct Unit 8A
- 4871 Karls Gate Dr
- 2082 Kinsmon Dr
- 1720 Little Willeo Rd
- 2100 Stone Hollow Ct
- 2039 Old Forge Way
- 1909 Bonaventure Way
- 1913 Bonaventure Way
- 0 Bonaventure Way Unit 8605785
- 1907 Bonaventure Way
- 1910 Bonaventure Way
- 1912 Bonaventure Way
- 1915 Bonaventure Way
- 1950 Bennetts Point Dr
- 1908 Bonaventure Way
- 1914 Bonaventure Way
- 1944 Bennetts Point Dr
- 1905 Bonaventure Way
- 1916 Bonaventure Way
- 1916 Bonaventure Way Unit X
- 1916 Bonaventure Way
- 1938 Bennetts Point Dr
- 4820 Bellingham Dr
- 4825 Bellingham Dr
- 1936 Fields Pond Dr
- 1904 Bonaventure Way