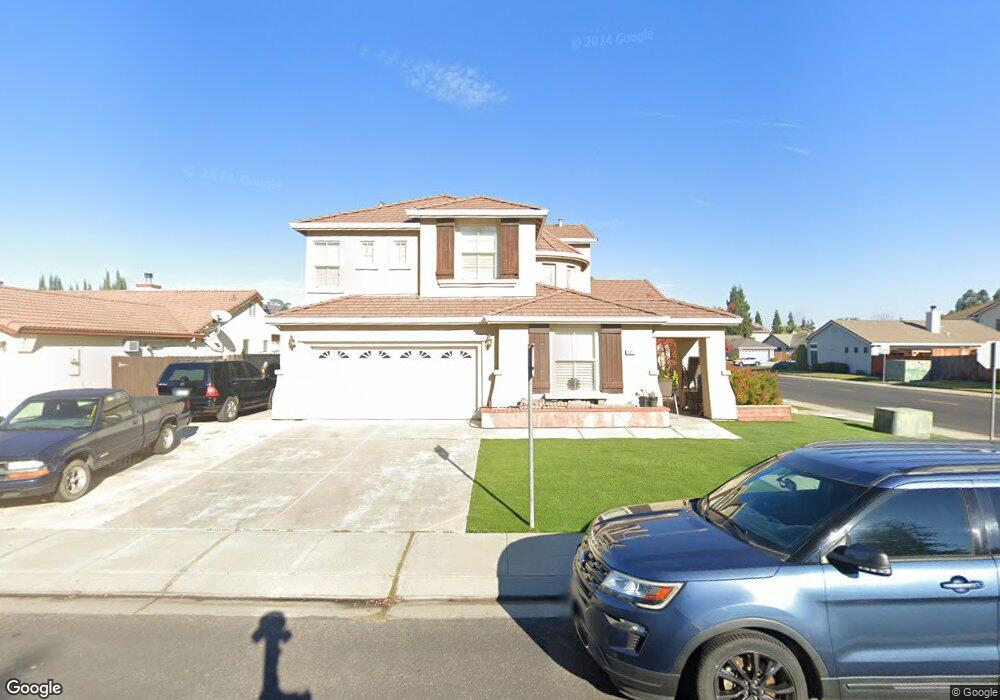
1911 Crom St Manteca, CA 95337
Estimated Value: $671,000 - $805,000
5
Beds
3
Baths
3,033
Sq Ft
$247/Sq Ft
Est. Value
About This Home
This home is located at 1911 Crom St, Manteca, CA 95337 and is currently estimated at $748,446, approximately $246 per square foot. 1911 Crom St is a home located in San Joaquin County with nearby schools including Stella Brockman Elementary School, Sierra High School, and BE.TECH Charter High School.
Ownership History
Date
Name
Owned For
Owner Type
Purchase Details
Closed on
Apr 4, 2011
Sold by
Central Valley Community Bank
Bought by
Rodrigues Stanley and Rodrigues Elvi Onofre
Current Estimated Value
Home Financials for this Owner
Home Financials are based on the most recent Mortgage that was taken out on this home.
Original Mortgage
$248,047
Outstanding Balance
$176,617
Interest Rate
5.5%
Mortgage Type
FHA
Estimated Equity
$571,829
Purchase Details
Closed on
Jan 20, 2011
Sold by
Mendoza Ivan A and Mendoza Thelma F
Bought by
Central Valley Community Bank
Purchase Details
Closed on
Mar 20, 2000
Sold by
Ticino Building Partners I Lp
Bought by
Mendoza Ivan A and Mendoza Thelma F
Home Financials for this Owner
Home Financials are based on the most recent Mortgage that was taken out on this home.
Original Mortgage
$159,305
Interest Rate
8.34%
Create a Home Valuation Report for This Property
The Home Valuation Report is an in-depth analysis detailing your home's value as well as a comparison with similar homes in the area
Purchase History
| Date | Buyer | Sale Price | Title Company |
|---|---|---|---|
| Rodrigues Stanley | $254,500 | First American Title Company | |
| Central Valley Community Bank | $25,000 | None Available | |
| Mendoza Ivan A | $256,500 | First American Title Co |
Source: Public Records
Mortgage History
| Date | Status | Borrower | Loan Amount |
|---|---|---|---|
| Open | Rodrigues Stanley | $248,047 | |
| Previous Owner | Mendoza Ivan A | $159,305 |
Source: Public Records
Tax History
| Year | Tax Paid | Tax Assessment Tax Assessment Total Assessment is a certain percentage of the fair market value that is determined by local assessors to be the total taxable value of land and additions on the property. | Land | Improvement |
|---|---|---|---|---|
| 2025 | $4,485 | $326,047 | $80,709 | $245,338 |
| 2024 | $4,383 | $319,655 | $79,127 | $240,528 |
| 2023 | $4,329 | $313,388 | $77,576 | $235,812 |
| 2022 | $4,295 | $307,244 | $76,055 | $231,189 |
| 2021 | $4,257 | $301,220 | $74,564 | $226,656 |
| 2020 | $4,117 | $298,132 | $73,800 | $224,332 |
| 2019 | $4,073 | $292,287 | $72,353 | $219,934 |
| 2018 | $4,007 | $286,557 | $70,935 | $215,622 |
| 2017 | $3,952 | $280,940 | $69,545 | $211,395 |
| 2016 | $3,882 | $275,433 | $68,182 | $207,251 |
| 2014 | $3,660 | $265,983 | $65,843 | $200,140 |
Source: Public Records
Map
Nearby Homes
- 380 N Airport Way
- 475 Brachetto Ln
- 496 Gavi Ln
- 1635 Crom St
- 1718 Flaxen Ct
- 1770 Flaxen Ct
- 2224 Lazio St
- 2224 Lazio Ct
- 602 Villa Ticino Dr
- 623 Villa Ticino Dr
- 650 Villa Ticino Dr
- 604 Spumante Ln
- 2231 Hewins St
- 674 Villa Ticino Dr
- 2253 Hewins St
- 364 Spumante Ln
- 2261 Hewins St
- 331 Spumante Ln
- 154 N Airport Way
- 319 Spumante Ln
Your Personal Tour Guide
Ask me questions while you tour the home.