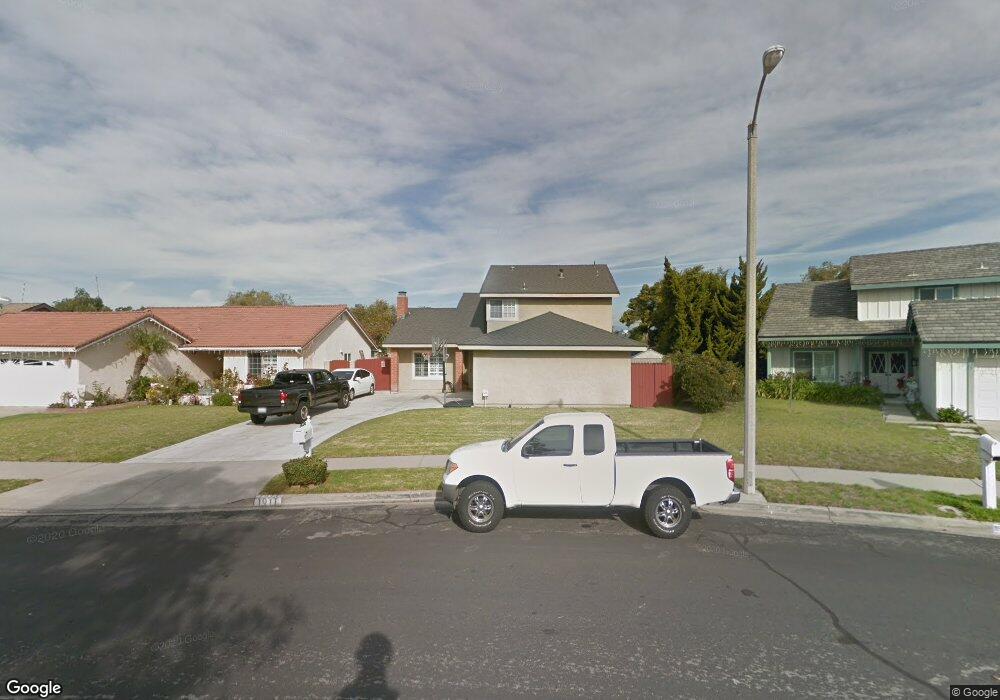
1911 El Greco Dr Oxnard, CA 93035
Marina West NeighborhoodEstimated Value: $686,000 - $839,251
4
Beds
3
Baths
1,830
Sq Ft
$432/Sq Ft
Est. Value
About This Home
This home is located at 1911 El Greco Dr, Oxnard, CA 93035 and is currently estimated at $791,313, approximately $432 per square foot. 1911 El Greco Dr is a home located in Ventura County with nearby schools including Marina West Elementary School and Oxnard High School.
Ownership History
Date
Name
Owned For
Owner Type
Purchase Details
Closed on
May 30, 1999
Sold by
Ignacio Raigoza and Ignacio Raigoza
Bought by
Raigoza Ignacio and Raigoza Angelita
Current Estimated Value
Purchase Details
Closed on
Jul 8, 1997
Sold by
Raigoza Maria Auxilio
Bought by
Raigoza Ignacio
Home Financials for this Owner
Home Financials are based on the most recent Mortgage that was taken out on this home.
Original Mortgage
$165,300
Interest Rate
7.58%
Purchase Details
Closed on
Jun 24, 1997
Sold by
Federal National Mortgage Association
Bought by
Raigoza Ignacio and Raigoza Ignacio
Home Financials for this Owner
Home Financials are based on the most recent Mortgage that was taken out on this home.
Original Mortgage
$165,300
Interest Rate
7.58%
Purchase Details
Closed on
Jul 18, 1996
Sold by
Jenkins Christopher and Jenkins Cathy L
Bought by
Federal National Mortgage Association
Create a Home Valuation Report for This Property
The Home Valuation Report is an in-depth analysis detailing your home's value as well as a comparison with similar homes in the area
Home Values in the Area
Average Home Value in this Area
Purchase History
| Date | Buyer | Sale Price | Title Company |
|---|---|---|---|
| Raigoza Ignacio | -- | -- | |
| Raigoza Ignacio | -- | Chicago Title Co | |
| Raigoza Ignacio | $174,000 | Chicago Title Co | |
| Federal National Mortgage Association | $175,832 | Continental Lawyers Title Co |
Source: Public Records
Mortgage History
| Date | Status | Borrower | Loan Amount |
|---|---|---|---|
| Previous Owner | Raigoza Ignacio | $165,300 |
Source: Public Records
Tax History
| Year | Tax Paid | Tax Assessment Tax Assessment Total Assessment is a certain percentage of the fair market value that is determined by local assessors to be the total taxable value of land and additions on the property. | Land | Improvement |
|---|---|---|---|---|
| 2025 | $3,316 | $277,773 | $111,108 | $166,665 |
| 2024 | $3,316 | $272,327 | $108,929 | $163,398 |
| 2023 | $3,194 | $266,988 | $106,793 | $160,195 |
| 2022 | $3,097 | $261,753 | $104,699 | $157,054 |
| 2021 | $3,071 | $256,621 | $102,646 | $153,975 |
| 2020 | $3,127 | $253,993 | $101,595 | $152,398 |
| 2019 | $3,038 | $249,013 | $99,603 | $149,410 |
| 2018 | $2,994 | $244,131 | $97,650 | $146,481 |
| 2017 | $2,841 | $239,345 | $95,736 | $143,609 |
| 2016 | $2,741 | $234,653 | $93,859 | $140,794 |
| 2015 | $2,769 | $231,130 | $92,450 | $138,680 |
| 2014 | -- | $226,604 | $90,640 | $135,964 |
Source: Public Records
Map
Nearby Homes
- 1501 Pisco Ln
- 1254 Miramar Walk
- 2213 Miramar Walk
- 2401 El Portal Way
- 2324 Miramar Walk
- 1309 Nautical Way
- 1174 Oyster Place Unit 15
- 1231 Lost Point Ln
- 807 Kingfisher Way
- 2900 Windward Way
- 2923 Kelp Ln Unit 11
- 1170 Windward Way
- 1720 Elsinore Cir
- 1030 Ilena St
- 137 E Garden Green
- 257 E Garden Green
- 13 W Garden Green
- 600 Freeport Ln
- 2400 W Hemlock St
- 83 W Garden Green
- 1921 El Greco Dr
- 1901 El Greco Dr
- 1931 El Greco Dr
- 1121 Callas Dr
- 1110 Callas Dr
- 1941 El Greco Dr
- 1120 Callas Dr
- 1120 Escalon Dr
- 1131 Callas Dr
- 1055 Saratoga St
- 1130 Callas Dr
- 1130 Escalon Dr
- 1054 Saratoga St
- 1111 Rivas Ln
- 1141 Callas Dr
- 1121 Rivas Ln
- 1010 Escalon Dr
- 1045 Saratoga St
- 1140 Callas Dr
- 1140 Escalon Dr
Your Personal Tour Guide
Ask me questions while you tour the home.