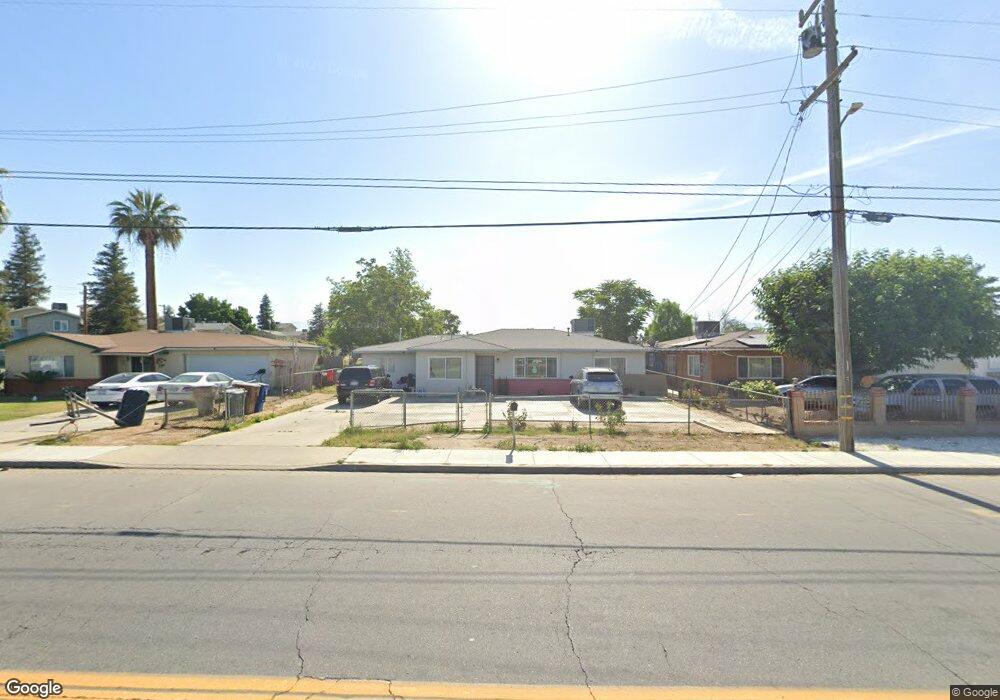
1911 Madison St Bakersfield, CA 93307
Estimated Value: $277,145 - $383,000
4
Beds
2
Baths
1,230
Sq Ft
$265/Sq Ft
Est. Value
About This Home
This home is located at 1911 Madison St, Bakersfield, CA 93307 and is currently estimated at $326,536, approximately $265 per square foot. 1911 Madison St is a home located in Kern County with nearby schools including Casa Loma Elementary School, Sequoia Middle School, and Mira Monte High School.
Ownership History
Date
Name
Owned For
Owner Type
Purchase Details
Closed on
Jul 11, 2024
Sold by
Lizama Flores Gregorio and Herrera Valdovinos Eduviges
Bought by
Valdovinos Eduviges Herrera
Current Estimated Value
Purchase Details
Closed on
Sep 16, 2009
Sold by
Fannie Mae
Bought by
Flores Gregorio Lizama and Herrera Eduviges
Purchase Details
Closed on
Aug 11, 2009
Sold by
Wilkerson Videl
Bought by
Federal National Mortgage Association
Create a Home Valuation Report for This Property
The Home Valuation Report is an in-depth analysis detailing your home's value as well as a comparison with similar homes in the area
Home Values in the Area
Average Home Value in this Area
Purchase History
| Date | Buyer | Sale Price | Title Company |
|---|---|---|---|
| Valdovinos Eduviges Herrera | -- | None Listed On Document | |
| Flores Gregorio Lizama | $50,000 | None Available | |
| Federal National Mortgage Association | $81,012 | Accommodation |
Source: Public Records
Tax History Compared to Growth
Tax History
| Year | Tax Paid | Tax Assessment Tax Assessment Total Assessment is a certain percentage of the fair market value that is determined by local assessors to be the total taxable value of land and additions on the property. | Land | Improvement |
|---|---|---|---|---|
| 2025 | $2,687 | $212,812 | $32,263 | $180,549 |
| 2024 | $1,429 | $183,523 | $31,631 | $151,892 |
| 2023 | $1,429 | $63,259 | $31,011 | $32,248 |
| 2022 | $1,383 | $62,019 | $30,403 | $31,616 |
| 2021 | $1,285 | $60,804 | $29,807 | $30,997 |
| 2020 | $1,250 | $60,182 | $29,502 | $30,680 |
| 2019 | $1,227 | $60,182 | $29,502 | $30,680 |
| 2018 | $1,202 | $57,847 | $28,357 | $29,490 |
| 2017 | $1,192 | $56,713 | $27,801 | $28,912 |
| 2016 | $1,118 | $55,602 | $27,256 | $28,346 |
| 2015 | $1,106 | $54,768 | $26,847 | $27,921 |
| 2014 | $1,072 | $53,697 | $26,322 | $27,375 |
Source: Public Records
Map
Nearby Homes