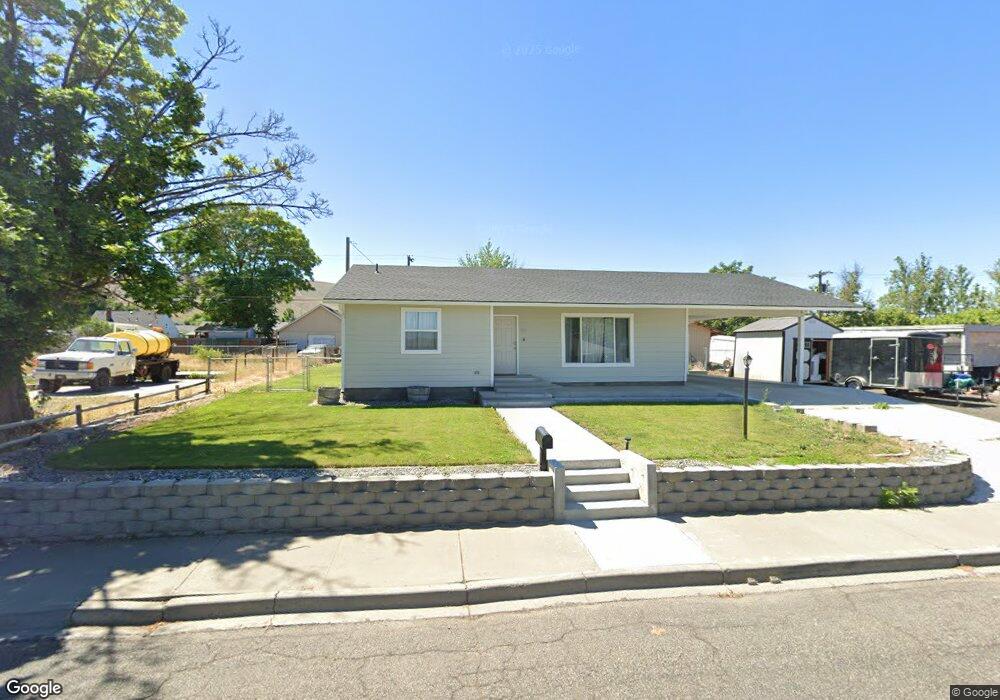
1911 Miller Ave Prosser, WA 99350
Estimated Value: $295,000 - $335,000
3
Beds
1
Bath
1,153
Sq Ft
$273/Sq Ft
Est. Value
About This Home
This home is located at 1911 Miller Ave, Prosser, WA 99350 and is currently estimated at $315,295, approximately $273 per square foot. 1911 Miller Ave is a home located in Benton County with nearby schools including Prosser High School and St Francis Preparatory School.
Ownership History
Date
Name
Owned For
Owner Type
Purchase Details
Closed on
Aug 3, 2015
Sold by
Colson Joshua C and Colson Josh C
Bought by
Colson Joshua C
Current Estimated Value
Home Financials for this Owner
Home Financials are based on the most recent Mortgage that was taken out on this home.
Original Mortgage
$123,394
Outstanding Balance
$96,484
Interest Rate
3.86%
Mortgage Type
FHA
Estimated Equity
$218,811
Purchase Details
Closed on
Dec 1, 2011
Sold by
Sherrett Cynthia M
Bought by
Winberry Cynthia Anne
Purchase Details
Closed on
Apr 9, 2010
Sold by
Winberry Cynthia Anne
Bought by
Colson Josh C
Home Financials for this Owner
Home Financials are based on the most recent Mortgage that was taken out on this home.
Original Mortgage
$132,554
Interest Rate
5.5%
Mortgage Type
FHA
Create a Home Valuation Report for This Property
The Home Valuation Report is an in-depth analysis detailing your home's value as well as a comparison with similar homes in the area
Home Values in the Area
Average Home Value in this Area
Purchase History
| Date | Buyer | Sale Price | Title Company |
|---|---|---|---|
| Colson Joshua C | -- | First American Title Ins Co | |
| Winberry Cynthia Anne | $50,713 | Benton Franklin Title Co | |
| Colson Josh C | $135,000 | Benton Franklin Title Co |
Source: Public Records
Mortgage History
| Date | Status | Borrower | Loan Amount |
|---|---|---|---|
| Open | Colson Joshua C | $123,394 | |
| Previous Owner | Colson Josh C | $132,554 |
Source: Public Records
Tax History Compared to Growth
Tax History
| Year | Tax Paid | Tax Assessment Tax Assessment Total Assessment is a certain percentage of the fair market value that is determined by local assessors to be the total taxable value of land and additions on the property. | Land | Improvement |
|---|---|---|---|---|
| 2024 | $1,771 | $274,220 | $90,000 | $184,220 |
| 2023 | $1,771 | $158,610 | $45,000 | $113,610 |
| 2022 | $1,673 | $138,220 | $45,000 | $93,220 |
| 2021 | $1,580 | $129,480 | $45,000 | $84,480 |
| 2020 | $1,545 | $123,650 | $45,000 | $78,650 |
| 2019 | $1,384 | $117,830 | $45,000 | $72,830 |
| 2018 | $1,860 | $112,000 | $45,000 | $67,000 |
| 2017 | $1,333 | $124,710 | $30,000 | $94,710 |
| 2016 | $1,332 | $124,710 | $30,000 | $94,710 |
| 2015 | $1,341 | $124,710 | $30,000 | $94,710 |
| 2014 | -- | $124,710 | $30,000 | $94,710 |
| 2013 | -- | $124,710 | $30,000 | $94,710 |
Source: Public Records
Map
Nearby Homes
- 1930 Benson Ave
- 1814 Highland Dr
- 2015 Benson Ave
- TBD Luther Ln
- Lot 4 Wine Country Rd
- Lot 3 Wine Country Rd
- Lot 2 Wine Country Rd
- Lot 5 Wine Country Rd
- 1106 Claire St
- 1937 Mountain View Dr
- 2236-2282 Frontier Rd
- 106 7th St
- 711 Guernsey St
- 618 New Gate Dr
- 973 Campbell Dr
- 976 Campbell Dr
- 1011 Sherman Ave
- 1021 Park Ave
- 1002 Sherman Ave
- 837 Court St
- 1915 Miller Ave
- 1909 Miller Ave
- 1908 Benson Ave
- 1910 Benson Ave
- 1906 Benson Ave
- 1910 Miller Ave
- 1912 Benson Ave
- 1919 Miller Ave
- 1903 Miller Ave
- 1914 Miller Ave
- 1908 Miller Ave
- 614 Mercer Ct
- 1914 Benson Ave
- 1921 Miller Ave
- 1900 Miller Ave
- 1918 Miller Ave
- 1900 Benson Ave
- 1918 Benson Ave
- 1920 Miller Ave
- 502 Mercer Ct