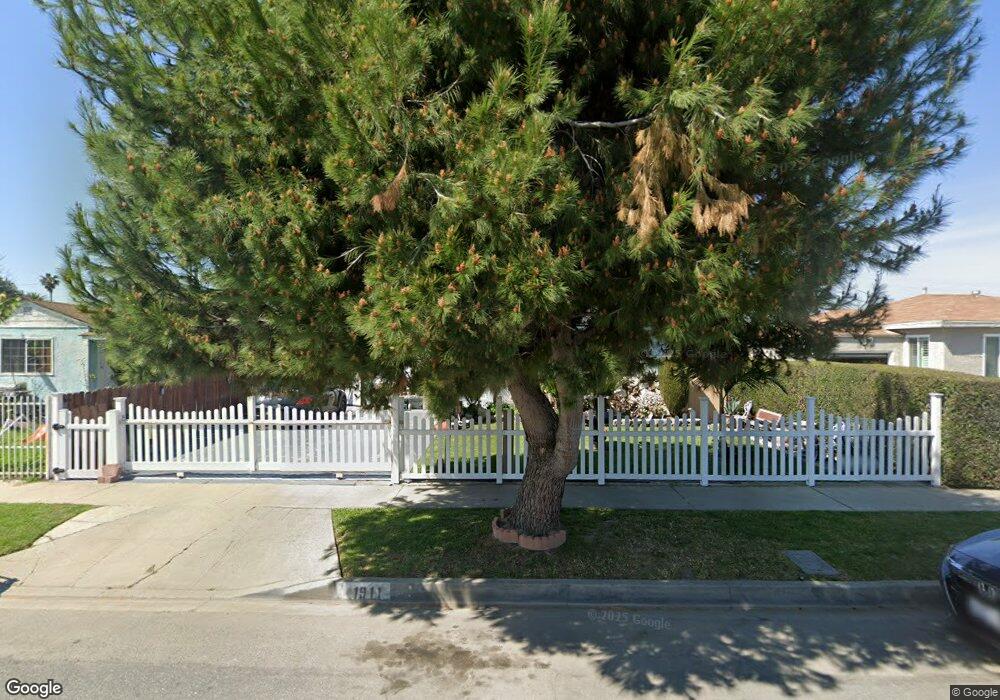
1911 N Grape Ave Compton, CA 90222
Estimated Value: $496,548 - $638,000
2
Beds
1
Bath
822
Sq Ft
$684/Sq Ft
Est. Value
About This Home
This home is located at 1911 N Grape Ave, Compton, CA 90222 and is currently estimated at $561,887, approximately $683 per square foot. 1911 N Grape Ave is a home located in Los Angeles County with nearby schools including Anderson Elementary School, Benjamin O. Davis Middle School, and Centennial High School.
Ownership History
Date
Name
Owned For
Owner Type
Purchase Details
Closed on
Sep 24, 2003
Sold by
Hud
Bought by
Paloblanco Pablo
Current Estimated Value
Home Financials for this Owner
Home Financials are based on the most recent Mortgage that was taken out on this home.
Original Mortgage
$126,100
Outstanding Balance
$59,141
Interest Rate
6.4%
Mortgage Type
Purchase Money Mortgage
Estimated Equity
$502,746
Purchase Details
Closed on
Aug 1, 2001
Sold by
Robles Jose Luis and Robles Maria G
Bought by
Hud
Purchase Details
Closed on
Jul 5, 2000
Sold by
Robles Jose Luis
Bought by
Phelan Associates
Purchase Details
Closed on
Nov 16, 1994
Sold by
Collins Willie and Collins Mary E
Bought by
Robles Jose Luis
Home Financials for this Owner
Home Financials are based on the most recent Mortgage that was taken out on this home.
Original Mortgage
$119,223
Interest Rate
9.27%
Mortgage Type
FHA
Create a Home Valuation Report for This Property
The Home Valuation Report is an in-depth analysis detailing your home's value as well as a comparison with similar homes in the area
Home Values in the Area
Average Home Value in this Area
Purchase History
| Date | Buyer | Sale Price | Title Company |
|---|---|---|---|
| Paloblanco Pablo | $130,000 | Fidelity | |
| Hud | $210,453 | United Title Company | |
| Phelan Associates | -- | -- | |
| Robles Jose Luis | $120,000 | Gateway Title Company |
Source: Public Records
Mortgage History
| Date | Status | Borrower | Loan Amount |
|---|---|---|---|
| Open | Paloblanco Pablo | $126,100 | |
| Previous Owner | Robles Jose Luis | $119,223 |
Source: Public Records
Tax History
| Year | Tax Paid | Tax Assessment Tax Assessment Total Assessment is a certain percentage of the fair market value that is determined by local assessors to be the total taxable value of land and additions on the property. | Land | Improvement |
|---|---|---|---|---|
| 2025 | $3,742 | $184,811 | $147,857 | $36,954 |
| 2024 | $3,742 | $181,188 | $144,958 | $36,230 |
| 2023 | $3,691 | $177,636 | $142,116 | $35,520 |
| 2022 | $3,497 | $174,154 | $139,330 | $34,824 |
| 2021 | $3,201 | $170,741 | $136,599 | $34,142 |
| 2019 | $3,403 | $165,679 | $132,549 | $33,130 |
| 2018 | $3,282 | $162,431 | $129,950 | $32,481 |
| 2016 | $3,106 | $156,125 | $124,904 | $31,221 |
| 2015 | $2,980 | $153,781 | $123,028 | $30,753 |
| 2014 | $2,932 | $150,770 | $120,619 | $30,151 |
Source: Public Records
Map
Nearby Homes
- 1808 N Grape Ave
- 813 W Stockwell St
- 2207 N Anzac Ave
- 1608 N Grape Ave
- 720 W 137th St
- 2102 E Lucien St
- 2107 E Stockwell St
- 850 W 132nd St
- 2062 E Hatchway St
- 924 W 134th Place
- 701 W 139th St
- 1716 N Grandee Ave
- 0 W 134th Place
- 910 W 138th St
- 629 W Plum St
- 1036 W Stockwell St
- 720 W Cherry St
- 2223 E Oris St
- 521 W Cherry St
- 522 W Cherry St
- 1915 N Grape Ave
- 1907 N Grape Ave
- 1908 N Anzac Ave
- 1919 N Grape Ave
- 1901 N Grape Ave
- 1903 N Grape Ave
- 1912 N Anzac Ave
- 1904 N Anzac Ave
- 1916 N Anzac Ave
- 1900 N Anzac Ave
- 1908 N Grape Ave
- 2003 N Grape Ave
- 1819 N Grape Ave
- 1912 N Grape Ave
- 1904 N Grape Ave
- 2000 N Anzac Ave
- 1916 N Grape Ave
- 1900 N Grape Ave
- 1816 N Anzac Ave
- 2007 N Grape Ave
Your Personal Tour Guide
Ask me questions while you tour the home.