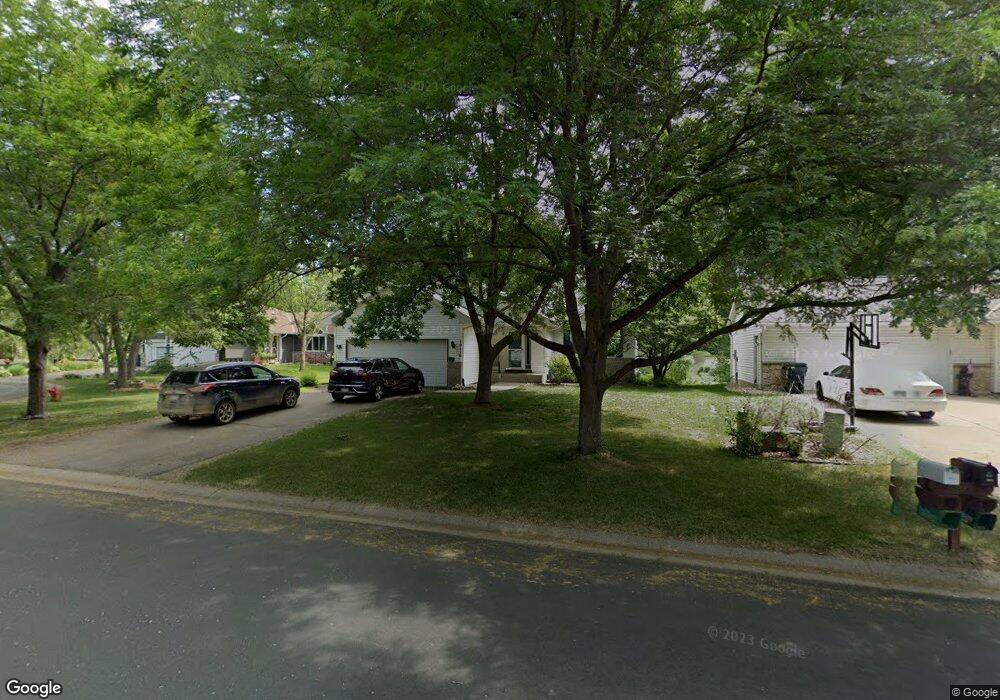
19116 Evening Star Way Farmington, MN 55024
Estimated Value: $398,000 - $427,000
3
Beds
2
Baths
1,132
Sq Ft
$362/Sq Ft
Est. Value
About This Home
This home is located at 19116 Evening Star Way, Farmington, MN 55024 and is currently estimated at $409,515, approximately $361 per square foot. 19116 Evening Star Way is a home located in Dakota County with nearby schools including Meadowview Elementary School, Robert Boeckman Middle School, and Farmington High School.
Ownership History
Date
Name
Owned For
Owner Type
Purchase Details
Closed on
Aug 25, 2021
Sold by
Lemmons Karen T
Bought by
Lemmons Timothy Robert Paul and Lemmons Jennifer Nicole
Current Estimated Value
Home Financials for this Owner
Home Financials are based on the most recent Mortgage that was taken out on this home.
Original Mortgage
$306,500
Outstanding Balance
$279,671
Interest Rate
2.99%
Mortgage Type
New Conventional
Estimated Equity
$129,844
Purchase Details
Closed on
Jun 19, 2020
Sold by
Quist Neal B and Quist Carrie J
Bought by
Lemmons Karen T
Home Financials for this Owner
Home Financials are based on the most recent Mortgage that was taken out on this home.
Original Mortgage
$306,850
Interest Rate
3.2%
Mortgage Type
New Conventional
Purchase Details
Closed on
Oct 11, 2000
Sold by
Joseph Friberg Industries Corp
Bought by
Quist Neal B and Quist Carrie J
Purchase Details
Closed on
Aug 17, 1998
Sold by
Builders Development Inc
Bought by
Starlight Homes Inc
Create a Home Valuation Report for This Property
The Home Valuation Report is an in-depth analysis detailing your home's value as well as a comparison with similar homes in the area
Home Values in the Area
Average Home Value in this Area
Purchase History
| Date | Buyer | Sale Price | Title Company |
|---|---|---|---|
| Lemmons Timothy Robert Paul | -- | Accommodation | |
| Lemmons Karen T | $323,000 | Land Title Inc | |
| Quist Neal B | $160,000 | -- | |
| Starlight Homes Inc | $39,900 | -- |
Source: Public Records
Mortgage History
| Date | Status | Borrower | Loan Amount |
|---|---|---|---|
| Open | Lemmons Timothy Robert Paul | $306,500 | |
| Closed | Lemmons Karen T | $306,850 |
Source: Public Records
Tax History Compared to Growth
Tax History
| Year | Tax Paid | Tax Assessment Tax Assessment Total Assessment is a certain percentage of the fair market value that is determined by local assessors to be the total taxable value of land and additions on the property. | Land | Improvement |
|---|---|---|---|---|
| 2024 | $4,114 | $349,500 | $100,400 | $249,100 |
| 2023 | $4,114 | $343,200 | $100,700 | $242,500 |
| 2022 | $3,812 | $336,600 | $97,500 | $239,100 |
| 2021 | $3,686 | $277,700 | $84,700 | $193,000 |
| 2020 | $3,614 | $267,600 | $80,700 | $186,900 |
| 2019 | $3,552 | $253,600 | $76,900 | $176,700 |
| 2018 | $3,542 | $245,300 | $73,200 | $172,100 |
| 2017 | $3,460 | $237,800 | $69,700 | $168,100 |
| 2016 | $3,392 | $226,900 | $66,300 | $160,600 |
| 2015 | $3,071 | $199,617 | $58,884 | $140,733 |
| 2014 | -- | $190,788 | $54,446 | $136,342 |
| 2013 | -- | $171,277 | $48,079 | $123,198 |
Source: Public Records
Map
Nearby Homes
- 19110 Euclid Path
- 19158 Everest Path
- 19298 Evening Star Way
- 19055 Enchanted Way
- 19353 Eureka Ct
- 18840 Enhance Ct
- 5412 188th St W
- 19325 Everfield Ave
- 19432 Everfield Ave
- 19313 Everfield Ave
- 19440 Everglade Path
- 19380 Everglade Path
- 19265 Everfield Ave
- Ivy Plan at Meadowview Preserve
- Linwood Plan at Meadowview Preserve
- Continental Plan at Meadowview Preserve
- Waverly Plan at Meadowview Preserve
- Mercer Plan at Meadowview Preserve
- 19461 Everglade Path
- 19410 Everglade Path
- 19128 Evening Star Way
- 19106 Evening Star Way
- 19142 Evening Star Way
- 19121 Evening Star Way
- 5760 191st St W
- 5751 191st St W
- 5753 191st St W
- 19137 Evening Star Way
- 5767 191st St W
- 19155 Evening Star Way
- 19114 Evenston Dr
- 19124 Evenston Dr
- 19164 Evening Star Way
- 5781 191st St W
- 19134 Evenston Dr
- 19171 Evening Star Way
- 5793 5793 191st-Street-w
- 19001 Euclid Path
- 5793 191st St W
- 19176 Evening Star Way