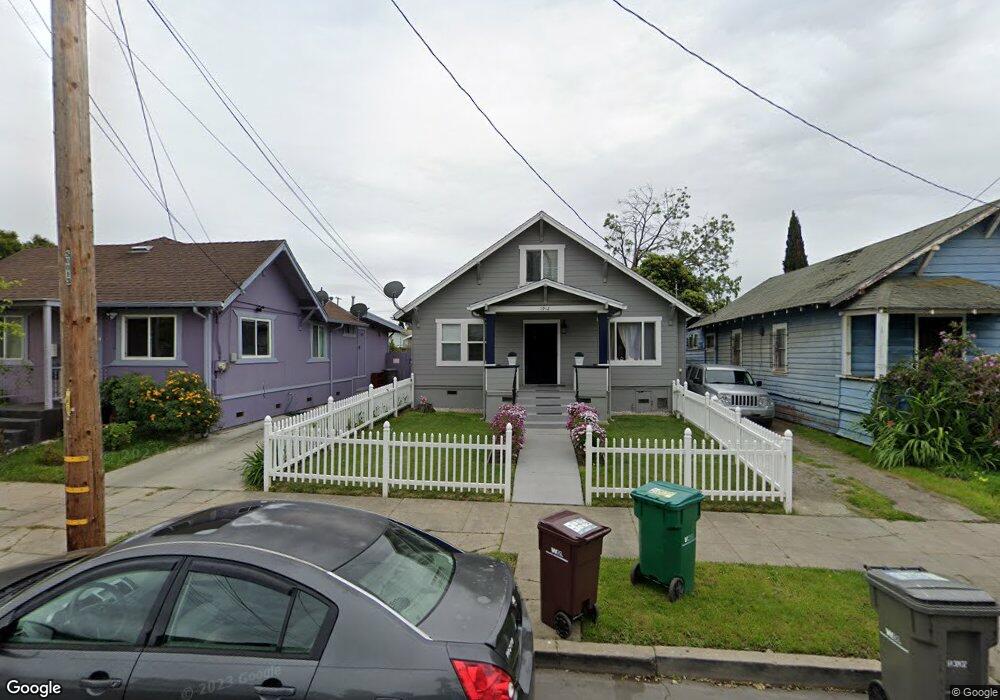
1912 85th Ave Oakland, CA 94621
Webster NeighborhoodEstimated Value: $465,000 - $525,000
3
Beds
1
Bath
1,124
Sq Ft
$441/Sq Ft
Est. Value
About This Home
This home is located at 1912 85th Ave, Oakland, CA 94621 and is currently estimated at $495,302, approximately $440 per square foot. 1912 85th Ave is a home located in Alameda County with nearby schools including East Oakland Pride Elementary School, Elmhurst United Middle School, and Coliseum College Prep Academy.
Ownership History
Date
Name
Owned For
Owner Type
Purchase Details
Closed on
Sep 7, 2017
Sold by
Medina Maria
Bought by
Cortez Gamaliel Medina
Current Estimated Value
Home Financials for this Owner
Home Financials are based on the most recent Mortgage that was taken out on this home.
Original Mortgage
$220,924
Outstanding Balance
$184,636
Interest Rate
3.93%
Mortgage Type
FHA
Estimated Equity
$310,666
Purchase Details
Closed on
Oct 19, 1998
Sold by
Goldfeather Marilyn E
Bought by
Medina Maria
Home Financials for this Owner
Home Financials are based on the most recent Mortgage that was taken out on this home.
Original Mortgage
$128,041
Interest Rate
6.71%
Mortgage Type
FHA
Purchase Details
Closed on
Aug 17, 1995
Sold by
Guillen Josefa D
Bought by
Goldfeather Marilyn E
Create a Home Valuation Report for This Property
The Home Valuation Report is an in-depth analysis detailing your home's value as well as a comparison with similar homes in the area
Home Values in the Area
Average Home Value in this Area
Purchase History
| Date | Buyer | Sale Price | Title Company |
|---|---|---|---|
| Cortez Gamaliel Medina | $225,000 | North American Title Co Inc | |
| Medina Maria | $128,500 | Financial Title Company | |
| Goldfeather Marilyn E | -- | -- |
Source: Public Records
Mortgage History
| Date | Status | Borrower | Loan Amount |
|---|---|---|---|
| Open | Cortez Gamaliel Medina | $220,924 | |
| Previous Owner | Medina Maria | $128,041 |
Source: Public Records
Tax History Compared to Growth
Tax History
| Year | Tax Paid | Tax Assessment Tax Assessment Total Assessment is a certain percentage of the fair market value that is determined by local assessors to be the total taxable value of land and additions on the property. | Land | Improvement |
|---|---|---|---|---|
| 2025 | $4,420 | $201,439 | $60,510 | $140,929 |
| 2024 | $4,420 | $197,489 | $59,323 | $138,166 |
| 2023 | $4,531 | $193,617 | $58,160 | $135,457 |
| 2022 | $4,352 | $189,822 | $57,020 | $132,802 |
| 2021 | $4,041 | $186,100 | $55,902 | $130,198 |
| 2020 | $3,993 | $184,192 | $55,329 | $128,863 |
| 2019 | $3,768 | $180,581 | $54,244 | $126,337 |
| 2018 | $3,690 | $177,041 | $53,181 | $123,860 |
| 2017 | $3,521 | $173,570 | $52,138 | $121,432 |
| 2016 | $3,332 | $170,167 | $51,116 | $119,051 |
| 2015 | $3,309 | $167,612 | $50,349 | $117,263 |
| 2014 | $3,208 | $164,328 | $49,362 | $114,966 |
Source: Public Records
Map
Nearby Homes