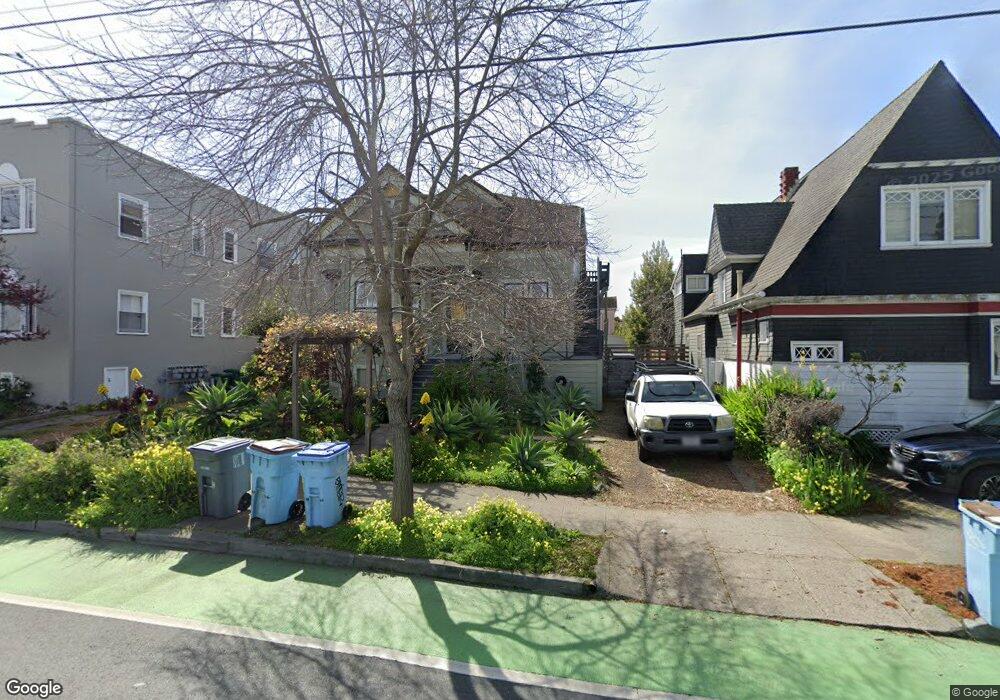
1912 Channing Way Berkeley, CA 94704
Downtown Berkeley NeighborhoodEstimated Value: $1,264,000 - $1,768,000
4
Beds
2
Baths
1,861
Sq Ft
$824/Sq Ft
Est. Value
About This Home
This home is located at 1912 Channing Way, Berkeley, CA 94704 and is currently estimated at $1,532,628, approximately $823 per square foot. 1912 Channing Way is a home located in Alameda County with nearby schools including Washington Elementary School, Berkeley Arts Magnet at Whittier School, and Malcolm X Elementary School.
Ownership History
Date
Name
Owned For
Owner Type
Purchase Details
Closed on
Apr 22, 2019
Sold by
Ehrlich Judith
Bought by
Judith Ehrlich Revocable Trust
Current Estimated Value
Purchase Details
Closed on
Oct 26, 1999
Sold by
Cameron Max
Bought by
Good Ingrid and The Ingrid Good Living Trust
Home Financials for this Owner
Home Financials are based on the most recent Mortgage that was taken out on this home.
Original Mortgage
$200,000
Outstanding Balance
$61,385
Interest Rate
7.82%
Estimated Equity
$1,471,243
Purchase Details
Closed on
Feb 4, 1994
Sold by
Bertoni Nicholas C
Bought by
Bertoni Nicholas C and Ehrlich Judith
Home Financials for this Owner
Home Financials are based on the most recent Mortgage that was taken out on this home.
Original Mortgage
$100,000
Interest Rate
7.24%
Create a Home Valuation Report for This Property
The Home Valuation Report is an in-depth analysis detailing your home's value as well as a comparison with similar homes in the area
Home Values in the Area
Average Home Value in this Area
Purchase History
| Date | Buyer | Sale Price | Title Company |
|---|---|---|---|
| Judith Ehrlich Revocable Trust | -- | None Available | |
| Good Ingrid | $410,000 | Placer Title Company | |
| Ehrlich Judith | -- | Placer Title Company | |
| Bertoni Nicholas C | -- | Commonwealth Land Title Ins |
Source: Public Records
Mortgage History
| Date | Status | Borrower | Loan Amount |
|---|---|---|---|
| Open | Good Ingrid | $200,000 | |
| Previous Owner | Bertoni Nicholas C | $100,000 |
Source: Public Records
Tax History
| Year | Tax Paid | Tax Assessment Tax Assessment Total Assessment is a certain percentage of the fair market value that is determined by local assessors to be the total taxable value of land and additions on the property. | Land | Improvement |
|---|---|---|---|---|
| 2025 | $6,891 | $146,183 | $47,522 | $105,661 |
| 2024 | $6,891 | $143,181 | $46,591 | $103,590 |
| 2023 | $6,653 | $147,236 | $45,677 | $101,559 |
| 2022 | $6,599 | $137,350 | $44,782 | $99,568 |
| 2021 | $6,550 | $134,520 | $43,904 | $97,616 |
| 2020 | $6,044 | $140,069 | $43,454 | $96,615 |
| 2019 | $5,615 | $137,323 | $42,602 | $94,721 |
| 2018 | $5,444 | $134,631 | $41,767 | $92,864 |
| 2017 | $5,223 | $131,991 | $40,948 | $91,043 |
| 2016 | $5,053 | $129,403 | $40,145 | $89,258 |
| 2015 | $4,789 | $127,460 | $39,542 | $87,918 |
| 2014 | $4,907 | $124,964 | $38,768 | $86,196 |
Source: Public Records
Map
Nearby Homes
- 1901 Parker St Unit 3
- 1819 Carleton St
- 2218 -2222 Grant St
- 1634 Blake St
- 1604 Dwight Way
- 2701 Grant St
- 1612 Parker St
- 1524 Blake St
- 2118 California St
- 2350 Sacramento St
- 1515 Derby St
- 2123 Oregon St
- 2304 Edwards St
- 2550 Dana St Unit 2F
- 2437 Acton St
- 2319 Ward St
- 2415 Blake St
- 2015 Delaware St
- 2015 Delaware St Unit A
- 2750 Sacramento St
- 1914 Channing Way Unit 4
- 1914 Channing Way Unit 6
- 1914 Channing Way Unit 5
- 1914 Channing Way Unit 1
- 1908 Channing Way
- 2409 Martin Luther King jr Way
- 2411 Martin Luther King jr Way
- 1900 Channing Way
- 1915 Haste St
- 1919 Haste St
- 1926 Channing Way Unit 1/2
- 1926 Channing Way Unit Half
- 1924 Channing Way Unit D
- 1924 Channing Way Unit C
- 1924 Channing Way Unit B
- 1924 Channing Way
- 1923 Haste St Unit 3
- 1923 Haste St Unit 2
- 1921 Haste St
- 1903 Haste St
Your Personal Tour Guide
Ask me questions while you tour the home.