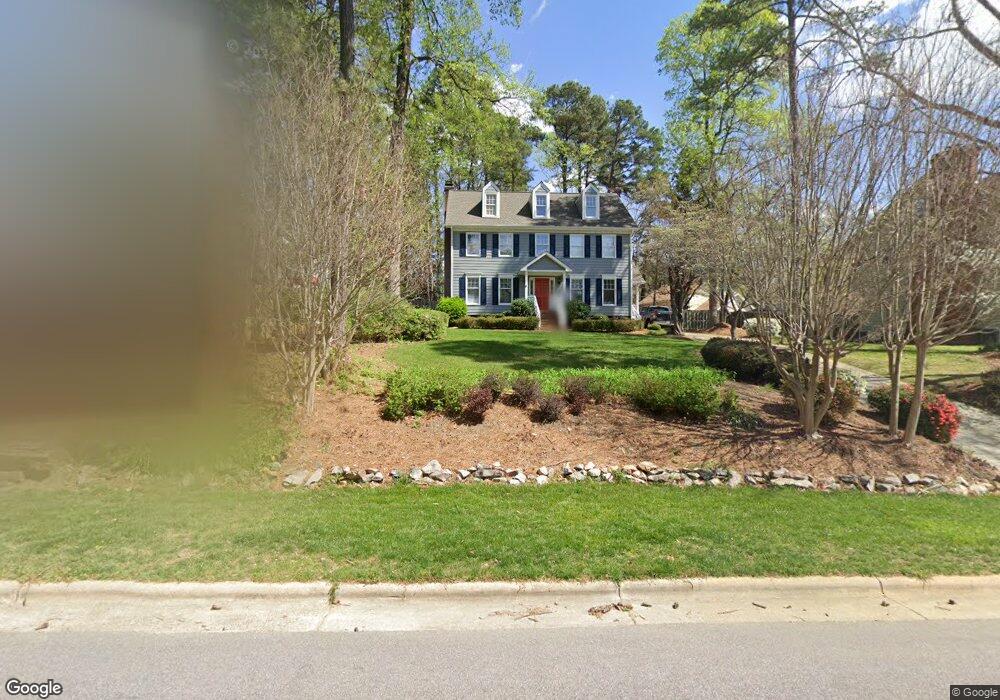
1912 Hamrick Dr Raleigh, NC 27615
Stonehenge East NeighborhoodEstimated Value: $664,185 - $729,000
4
Beds
3
Baths
2,606
Sq Ft
$268/Sq Ft
Est. Value
About This Home
This home is located at 1912 Hamrick Dr, Raleigh, NC 27615 and is currently estimated at $697,296, approximately $267 per square foot. 1912 Hamrick Dr is a home located in Wake County with nearby schools including Lead Mine Elementary School, Carroll Middle, and Sanderson High School.
Ownership History
Date
Name
Owned For
Owner Type
Purchase Details
Closed on
Jul 9, 2015
Sold by
Daye Fernell L and Daye Angela
Bought by
Cadwallader Christopher B and Cadwallader Elizabeth
Current Estimated Value
Home Financials for this Owner
Home Financials are based on the most recent Mortgage that was taken out on this home.
Original Mortgage
$259,150
Outstanding Balance
$202,563
Interest Rate
3.93%
Mortgage Type
New Conventional
Estimated Equity
$494,733
Purchase Details
Closed on
Aug 27, 1999
Sold by
Ruhl William G and Ruhl Juliet C
Bought by
Daye Fernell L and Daye Angela
Home Financials for this Owner
Home Financials are based on the most recent Mortgage that was taken out on this home.
Original Mortgage
$197,400
Interest Rate
7.58%
Purchase Details
Closed on
Jan 15, 1998
Sold by
Wright William Raymond
Bought by
Ruhl William G and Ruhl Juliet C
Home Financials for this Owner
Home Financials are based on the most recent Mortgage that was taken out on this home.
Original Mortgage
$170,000
Interest Rate
7.16%
Create a Home Valuation Report for This Property
The Home Valuation Report is an in-depth analysis detailing your home's value as well as a comparison with similar homes in the area
Home Values in the Area
Average Home Value in this Area
Purchase History
| Date | Buyer | Sale Price | Title Company |
|---|---|---|---|
| Cadwallader Christopher B | $324,000 | Attorney | |
| Daye Fernell L | $216,000 | -- | |
| Ruhl William G | $212,500 | -- |
Source: Public Records
Mortgage History
| Date | Status | Borrower | Loan Amount |
|---|---|---|---|
| Open | Cadwallader Christopher B | $259,150 | |
| Previous Owner | Daye Fernell L | $197,400 | |
| Previous Owner | Ruhl William G | $170,000 |
Source: Public Records
Tax History Compared to Growth
Tax History
| Year | Tax Paid | Tax Assessment Tax Assessment Total Assessment is a certain percentage of the fair market value that is determined by local assessors to be the total taxable value of land and additions on the property. | Land | Improvement |
|---|---|---|---|---|
| 2025 | $4,845 | $553,256 | $205,000 | $348,256 |
| 2024 | $4,825 | $553,256 | $205,000 | $348,256 |
| 2023 | $4,198 | $383,330 | $140,000 | $243,330 |
| 2022 | $3,901 | $383,330 | $140,000 | $243,330 |
| 2021 | $3,750 | $383,330 | $140,000 | $243,330 |
| 2020 | $3,682 | $383,330 | $140,000 | $243,330 |
| 2019 | $3,863 | $331,617 | $142,000 | $189,617 |
| 2018 | $3,643 | $331,617 | $142,000 | $189,617 |
| 2017 | $3,470 | $331,617 | $142,000 | $189,617 |
| 2016 | $3,399 | $331,617 | $142,000 | $189,617 |
| 2015 | -- | $302,789 | $142,000 | $160,789 |
| 2014 | $2,993 | $302,789 | $142,000 | $160,789 |
Source: Public Records
Map
Nearby Homes
- 8420 Caldbeck Dr
- 8521 Harbor Dr
- 7771 Falcon Rest Cir Unit 7771
- 7704 Falcon Rest Cir
- 1516 Bridgeport Dr
- 8825 Leeshire Ln
- 8305 Greywinds Dr
- 8337 Greywinds Dr
- 7922 Footman Way
- 3008 Eden Harbor Ct
- 1032 Vestavia Woods Dr
- 7820 Harbor Dr
- 8904 Mildenhall Ct
- 1308 Hillbrow Ln Unit 203
- 8700 Aldersgate Way
- 8308 Grey Abbey Place
- 1432 Quarter Point
- 8121 Greys Landing Way
- 8404 Sleepy Creek Dr
- 2300 Valley Forge Dr
- 1901 Wilton Cir
- 8109 Winstone Ct
- 1905 Wilton Cir
- 8105 Winstone Ct
- 1909 Wilton Cir
- 1917 Hamrick Dr
- 8101 Winstone Ct
- 1913 Hamrick Dr
- 1913 Wilton Cir
- 1921 Hamrick Dr
- 1900 Wilton Cir
- 1909 Hamrick Dr
- 1925 Hamrick Dr
- 1904 Wilton Cir
- 1917 Wilton Cir
- 8104 Winstone Ct
- 8100 Winstone Ct
- 1908 Wilton Cir
- 2001 Hamrick Dr
- 1905 Hamrick Dr