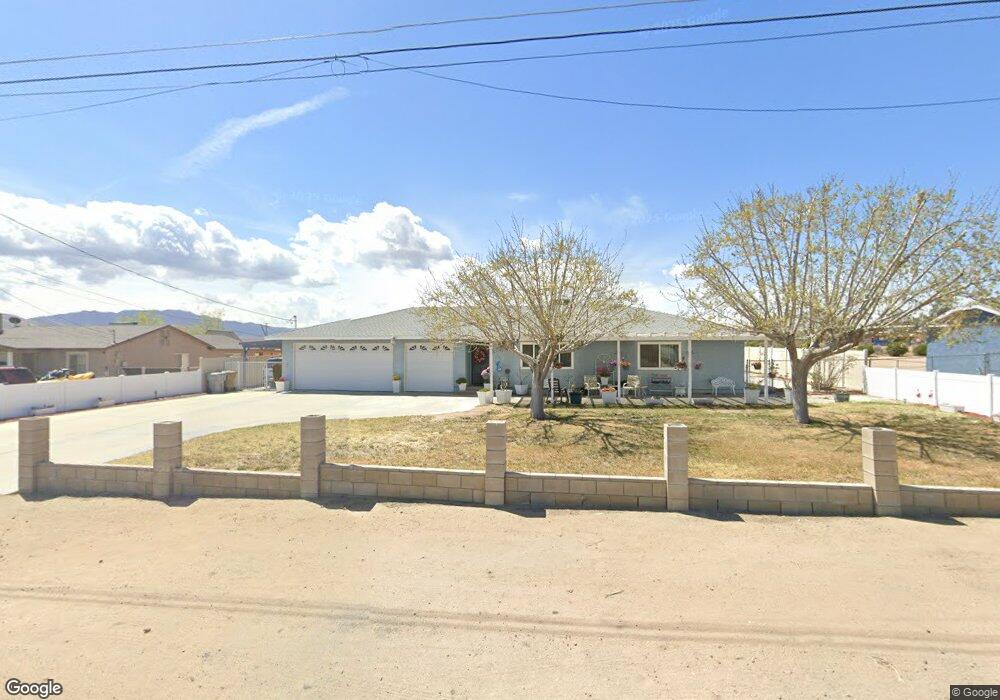
19121 Vine St Hesperia, CA 92345
Estimated Value: $420,777 - $466,000
3
Beds
2
Baths
1,600
Sq Ft
$274/Sq Ft
Est. Value
About This Home
This home is located at 19121 Vine St, Hesperia, CA 92345 and is currently estimated at $437,694, approximately $273 per square foot. 19121 Vine St is a home located in San Bernardino County with nearby schools including Carmel Elementary School, Ranchero Middle School, and Sultana High School.
Ownership History
Date
Name
Owned For
Owner Type
Purchase Details
Closed on
Aug 15, 2006
Sold by
Booth Kelli Jo
Bought by
Booth Kelli Jo
Current Estimated Value
Home Financials for this Owner
Home Financials are based on the most recent Mortgage that was taken out on this home.
Original Mortgage
$218,084
Interest Rate
6.76%
Mortgage Type
New Conventional
Purchase Details
Closed on
Jul 8, 2005
Sold by
Booth William Thomas
Bought by
Booth Kelli Jo
Purchase Details
Closed on
Jul 10, 1998
Sold by
Jo Thomas Booth Kelli Jo and Jo Kelli
Bought by
Booth William Thomas and Booth Kelli Jo
Home Financials for this Owner
Home Financials are based on the most recent Mortgage that was taken out on this home.
Original Mortgage
$76,300
Interest Rate
7%
Purchase Details
Closed on
Oct 24, 1994
Sold by
Thomas Booth Kelli Jo and Thomas Kelli Jo
Bought by
Thomas Booth Kelli Jo
Home Financials for this Owner
Home Financials are based on the most recent Mortgage that was taken out on this home.
Original Mortgage
$77,500
Interest Rate
8.7%
Create a Home Valuation Report for This Property
The Home Valuation Report is an in-depth analysis detailing your home's value as well as a comparison with similar homes in the area
Home Values in the Area
Average Home Value in this Area
Purchase History
| Date | Buyer | Sale Price | Title Company |
|---|---|---|---|
| Booth Kelli Jo | -- | None Available | |
| Booth Kelli Jo | -- | -- | |
| Booth William Thomas | -- | Fidelity National Title Co | |
| Thomas Booth Kelli Jo | -- | Commonwealth Land Title Co |
Source: Public Records
Mortgage History
| Date | Status | Borrower | Loan Amount |
|---|---|---|---|
| Closed | Booth Kelli Jo | $218,084 | |
| Closed | Booth William Thomas | $76,300 | |
| Closed | Thomas Booth Kelli Jo | $77,500 |
Source: Public Records
Tax History Compared to Growth
Tax History
| Year | Tax Paid | Tax Assessment Tax Assessment Total Assessment is a certain percentage of the fair market value that is determined by local assessors to be the total taxable value of land and additions on the property. | Land | Improvement |
|---|---|---|---|---|
| 2025 | $1,466 | $138,900 | $13,943 | $124,957 |
| 2024 | $1,466 | $136,177 | $13,670 | $122,507 |
| 2023 | $1,449 | $133,507 | $13,402 | $120,105 |
| 2022 | $1,415 | $130,889 | $13,139 | $117,750 |
| 2021 | $1,389 | $128,322 | $12,881 | $115,441 |
| 2020 | $1,372 | $127,006 | $12,749 | $114,257 |
| 2019 | $1,343 | $124,516 | $12,499 | $112,017 |
| 2018 | $1,317 | $122,075 | $12,254 | $109,821 |
| 2017 | $1,293 | $119,682 | $12,014 | $107,668 |
| 2016 | $1,265 | $117,335 | $11,778 | $105,557 |
| 2015 | -- | $115,572 | $11,601 | $103,971 |
| 2014 | $1,230 | $113,308 | $11,374 | $101,934 |
Source: Public Records
Map
Nearby Homes
- 19101 Live Oak St
- 19158 Live Oak St
- 9193 Piedra Ave
- 19077 Goleta St
- 18994 Vine St
- 9022 Glendale Ave
- 9381 Choiceana Ave
- 8944 Glendale Ave
- 0 Rock Springs Rd Unit HD25231516
- 0 Glendale Ave Unit HD25103572
- 0 Glendale Ave Unit HD25103550
- 19223 Rocksprings Rd
- 9503 San Pablo Ave
- 9546 Verdugo Ave
- 19095 Madrone St
- 19019 Madrone St
- 9546 San Pablo Ave
- 18742 Vine St
- 18747 Albany Ct
- 18646 Main St
- 19135 Vine St
- 19105 Vine St
- 19187 Vine St
- 19149 Vine St
- 19097 Vine St
- 9206 Verdugo Ave
- 19076 Live Oak St
- 19094 Live Oak St
- 19085 Vine St
- 19060 Live Oak St
- 9226 Verdugo Ave
- 19106 Live Oak St
- 9201 Verdugo Ave
- 19050 Live Oak St
- 19120 Live Oak St
- 9255 Delmar Ave
- 19175 Vine St
- 19073 Vine St
- 9240 Verdugo Ave
- 19040 Live Oak St