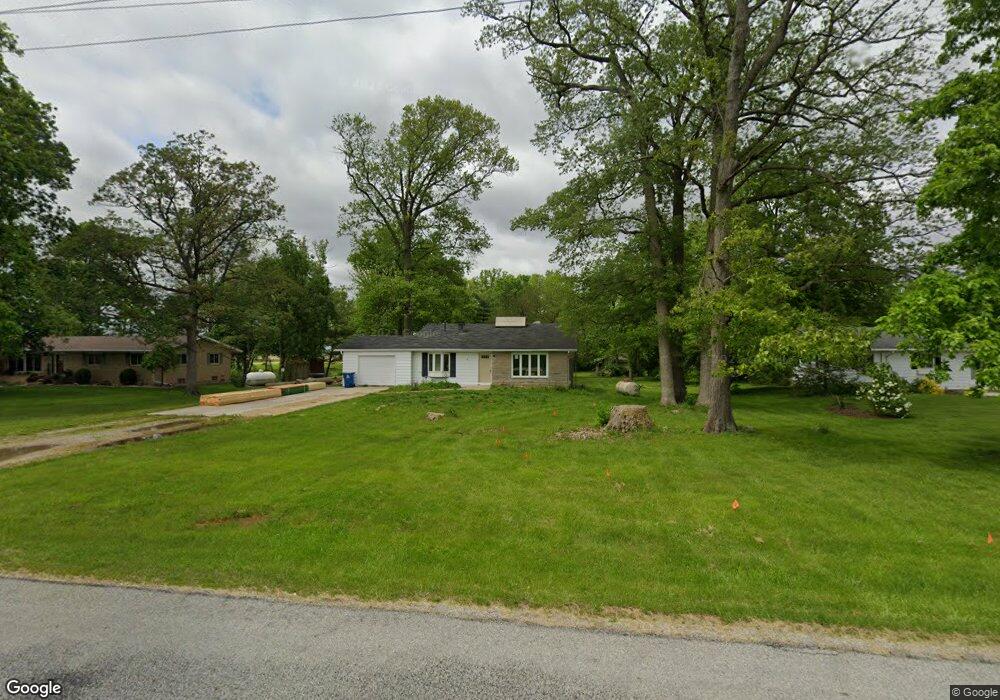
19123 Maples Rd Monroeville, IN 46773
Estimated Value: $239,000 - $300,000
About This Home
This home is located at 19123 Maples Rd, Monroeville, IN 46773 and is currently estimated at $278,560, approximately $148 per square foot. 19123 Maples Rd is a home located in Allen County with nearby schools including Heritage Junior/Senior High School and St Rose of Lima Catholic School.
Ownership History
We collect this data history from publicly available records. To have your information removed, we recommend requesting removal directly through your county’s website.
Purchase Details
Home Financials for this Owner
Home Financials are based on the most recent Mortgage that was taken out on this home.Purchase Details
Home Financials for this Owner
Home Financials are based on the most recent Mortgage that was taken out on this home.Purchase Details
Home Financials for this Owner
Home Financials are based on the most recent Mortgage that was taken out on this home.Purchase History
We collect this data history from publicly available records. To have your information removed, we recommend requesting removal directly through your county’s website.
| Date | Buyer | Sale Price | Title Company |
|---|---|---|---|
| -- | None Listed On Document | ||
| -- | American Title | ||
| -- | Equisure Title Corp |
Mortgage History
We collect this data history from publicly available records. To have your information removed, we recommend requesting removal directly through your county’s website.
| Date | Status | Borrower | Loan Amount |
|---|---|---|---|
| Closed | $312,300 | ||
| Previous Owner | $110,700 | ||
| Previous Owner | $99,500 |
Tax History
We collect this data history from publicly available records. To have your information removed, we recommend requesting removal directly through your county’s website.
| Year | Tax Paid | Tax Assessment Tax Assessment Total Assessment is a certain percentage of the fair market value that is determined by local assessors to be the total taxable value of land and additions on the property. | Land | Improvement |
|---|---|---|---|---|
| 2025 | $1,961 | $266,800 | $27,800 | $239,000 |
| 2024 | $2,157 | $183,100 | $27,800 | $155,300 |
| 2022 | $1,654 | $102,900 | $18,600 | $84,300 |
| 2021 | $1,813 | $100,900 | $21,800 | $79,100 |
| 2020 | $1,516 | $98,400 | $23,000 | $75,400 |
| 2019 | $1,305 | $82,600 | $21,000 | $61,600 |
| 2018 | $1,268 | $77,200 | $20,600 | $56,600 |
| 2017 | $1,326 | $77,200 | $20,700 | $56,500 |
| 2016 | $1,322 | $77,000 | $21,200 | $55,800 |
| 2014 | $1,302 | $76,600 | $22,200 | $54,400 |
| 2013 | $1,348 | $77,000 | $22,700 | $54,300 |
Map
- 19133 Maples Rd
- 9913 Sampson Rd
- TBD Monroeville Rd
- 106 S Short St
- 118 W Forest St
- 307 Monroe St
- 13335 Church St
- 13002 U S 30
- 19900 Dawkins Rd
- 11732 E Tillman Rd
- 14512 Dawkins Rd
- 11849 Flatrock Rd
- 10911 Minnich Rd
- 503 N Webster Rd
- 10913 Monroeville Rd
- 14720 State Line Rd
- 5135 Buffay Ct
- 5065 Buffay Ct
- 5057 Buffay Ct
- 5210 Beechmont Ln
- 19103 Maples Rd
- 19207 Maples Rd
- 19250 Maples Rd
- 8711 Ternet Rd
- 19301 Maples Rd
- 8633 Ternet Rd
- 18902 Maples Rd
- 19415 Maples Rd
- 18625 Maples Rd
- 18529 Maples Rd
- 19731 Maples Rd
- 8131 Ternet Rd
- 19811 Maples Rd
- 8119 Ternet Rd
- 8107 Ternet Rd
- 8110 Ternet Rd
- 19935 Maples Rd
- 18215 Maples Rd
- 18226 Maples Rd
- 8109 Sampson Rd
Ask me questions while you tour the home.