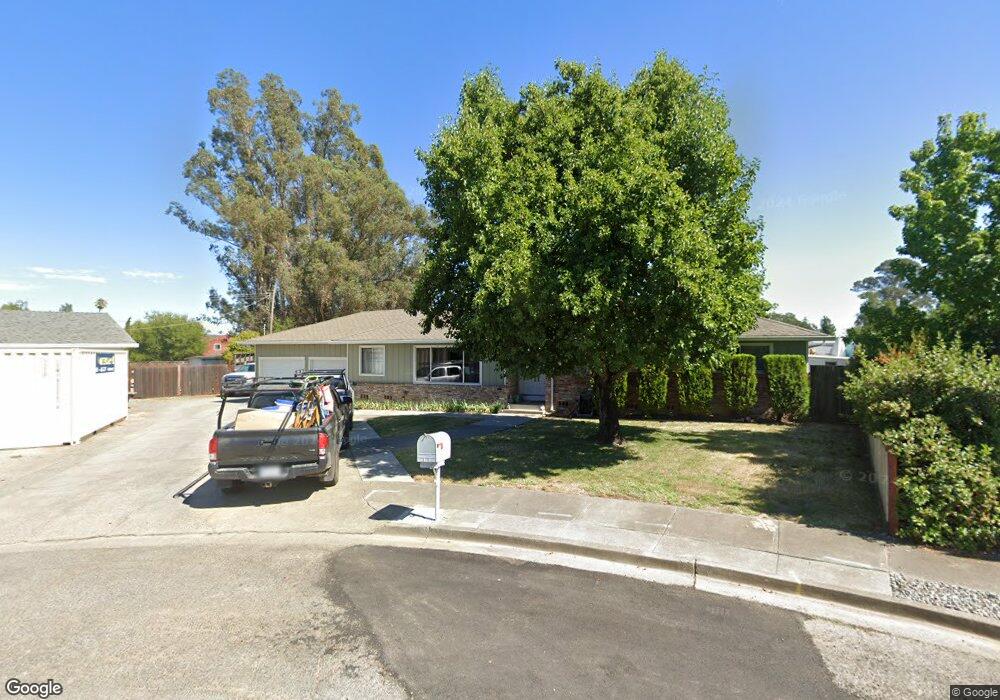
19127 Ola Ct Sonoma, CA 95476
Estimated Value: $881,045 - $1,270,000
3
Beds
2
Baths
1,740
Sq Ft
$636/Sq Ft
Est. Value
About This Home
This home is located at 19127 Ola Ct, Sonoma, CA 95476 and is currently estimated at $1,106,761, approximately $636 per square foot. 19127 Ola Ct is a home located in Sonoma County with nearby schools including El Verano Elementary School, Altimira Middle School, and Creekside High School.
Ownership History
Date
Name
Owned For
Owner Type
Purchase Details
Closed on
Apr 16, 2021
Sold by
Sloane Vincent Lawrence and Vincent L Sloane Jr Trust
Bought by
Sloane Vincent L and Sloane Michele
Current Estimated Value
Home Financials for this Owner
Home Financials are based on the most recent Mortgage that was taken out on this home.
Original Mortgage
$180,000
Outstanding Balance
$162,518
Interest Rate
3%
Mortgage Type
New Conventional
Estimated Equity
$944,243
Purchase Details
Closed on
Aug 16, 2013
Sold by
Sloane Vincent L
Bought by
Sloane Vincent Lawrence and Vincent L Sloane Jr Trust
Purchase Details
Closed on
Nov 4, 2008
Sold by
Sloane Vincent L
Bought by
Sloane Vincent L
Home Financials for this Owner
Home Financials are based on the most recent Mortgage that was taken out on this home.
Original Mortgage
$130,000
Interest Rate
6.07%
Mortgage Type
New Conventional
Create a Home Valuation Report for This Property
The Home Valuation Report is an in-depth analysis detailing your home's value as well as a comparison with similar homes in the area
Home Values in the Area
Average Home Value in this Area
Purchase History
| Date | Buyer | Sale Price | Title Company |
|---|---|---|---|
| Sloane Vincent L | -- | First American Title Company | |
| Sloane Vincent Lawrence | -- | None Available | |
| Sloane Vincent L | -- | First American Title Company |
Source: Public Records
Mortgage History
| Date | Status | Borrower | Loan Amount |
|---|---|---|---|
| Open | Sloane Vincent L | $180,000 | |
| Previous Owner | Sloane Vincent L | $130,000 |
Source: Public Records
Tax History Compared to Growth
Tax History
| Year | Tax Paid | Tax Assessment Tax Assessment Total Assessment is a certain percentage of the fair market value that is determined by local assessors to be the total taxable value of land and additions on the property. | Land | Improvement |
|---|---|---|---|---|
| 2025 | $1,495 | $88,418 | $17,779 | $70,639 |
| 2024 | $1,495 | $86,685 | $17,431 | $69,254 |
| 2023 | $1,495 | $84,987 | $17,090 | $67,897 |
| 2022 | $1,432 | $83,321 | $16,755 | $66,566 |
| 2021 | $1,385 | $855,000 | $525,000 | $330,000 |
| 2020 | $1,272 | $80,851 | $16,259 | $64,592 |
| 2019 | $1,143 | $79,267 | $15,941 | $63,326 |
| 2018 | $1,131 | $77,714 | $15,629 | $62,085 |
| 2017 | $1,116 | $76,191 | $15,323 | $60,868 |
| 2016 | $1,008 | $74,698 | $15,023 | $59,675 |
| 2015 | $983 | $73,577 | $14,798 | $58,779 |
| 2014 | $970 | $72,137 | $14,509 | $57,628 |
Source: Public Records
Map
Nearby Homes
- 19031 Hickory St
- 883 Arbor Ave
- 654 Walnut Ave
- 740 W Verano Ave
- 1420 Grove St
- 18785 Gillman Dr
- 0 Verano Ave Unit 325007610
- 0 Verano Ave Unit 323929512
- 527 Hopkins St
- 18878 Jami Lee Ln
- 19030 Railroad Ave
- 391 Oak St
- 1230 Fowler Creek Rd
- 18770 Park Tree Ln
- 677 Petaluma Ave
- 842 Country Meadow Ln
- 621 Jericho Rd
- 18746 Park Tree Ln
- 18502 Wellesley Ct
- 18225 Cottonwood Ave