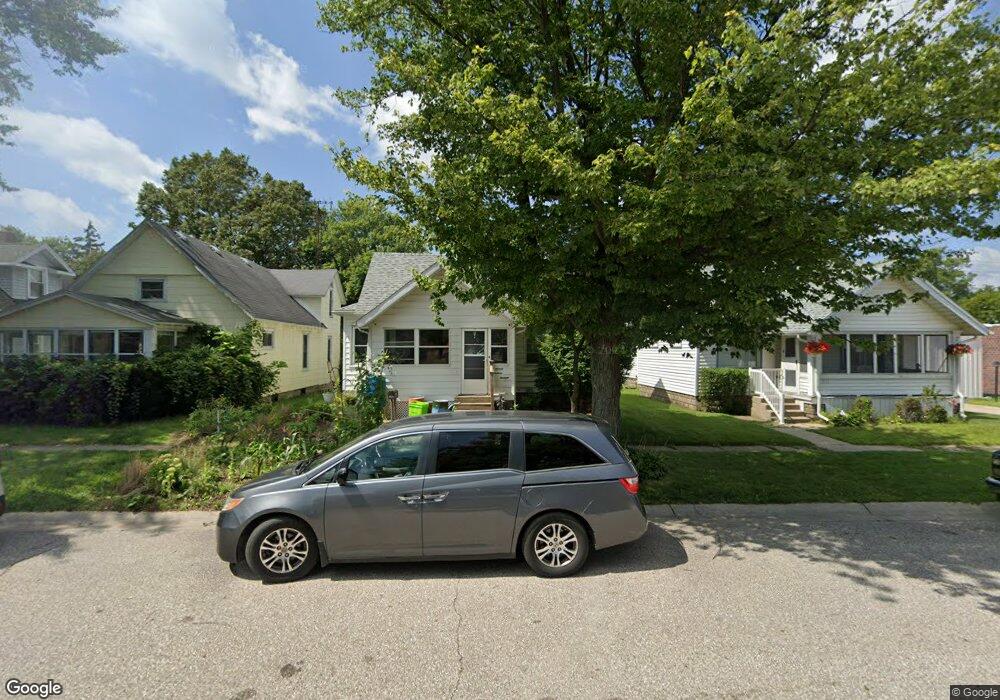
1913 6th St Port Huron, MI 48060
Estimated Value: $125,000 - $140,000
3
Beds
1
Bath
1,164
Sq Ft
$112/Sq Ft
Est. Value
About This Home
This home is located at 1913 6th St, Port Huron, MI 48060 and is currently estimated at $130,013, approximately $111 per square foot. 1913 6th St is a home located in St. Clair County with nearby schools including Woodrow Wilson Elementary School, Central Middle School, and Port Huron High School.
Ownership History
Date
Name
Owned For
Owner Type
Purchase Details
Closed on
Aug 15, 2016
Sold by
Jc Gemini Iii D Llc
Bought by
Jc Gemini Iii E Llc
Current Estimated Value
Purchase Details
Closed on
Sep 9, 2011
Sold by
Fannie Mae
Bought by
Lee Martin F
Purchase Details
Closed on
Sep 17, 2010
Sold by
Aldrich Timothy and Aldrich Renee
Bought by
Federal National Mortgage Association
Create a Home Valuation Report for This Property
The Home Valuation Report is an in-depth analysis detailing your home's value as well as a comparison with similar homes in the area
Home Values in the Area
Average Home Value in this Area
Purchase History
| Date | Buyer | Sale Price | Title Company |
|---|---|---|---|
| Jc Gemini Iii E Llc | -- | Huron Title | |
| Lee Martin F | $13,000 | Etitle Agency Inc | |
| Federal National Mortgage Association | $59,061 | None Available |
Source: Public Records
Tax History Compared to Growth
Tax History
| Year | Tax Paid | Tax Assessment Tax Assessment Total Assessment is a certain percentage of the fair market value that is determined by local assessors to be the total taxable value of land and additions on the property. | Land | Improvement |
|---|---|---|---|---|
| 2025 | $1,247 | $52,500 | $0 | $0 |
| 2024 | $1,006 | $49,700 | $0 | $0 |
| 2023 | $951 | $44,000 | $0 | $0 |
| 2022 | $934 | $36,600 | $0 | $0 |
| 2021 | $888 | $31,400 | $0 | $0 |
| 2020 | $898 | $27,400 | $27,400 | $0 |
| 2019 | $882 | $19,300 | $0 | $0 |
| 2018 | $863 | $19,300 | $0 | $0 |
| 2017 | $772 | $18,100 | $0 | $0 |
| 2016 | $649 | $18,100 | $0 | $0 |
| 2015 | $674 | $18,100 | $18,100 | $0 |
| 2014 | $674 | $18,800 | $18,800 | $0 |
| 2013 | -- | $20,500 | $0 | $0 |
Source: Public Records
Map
Nearby Homes