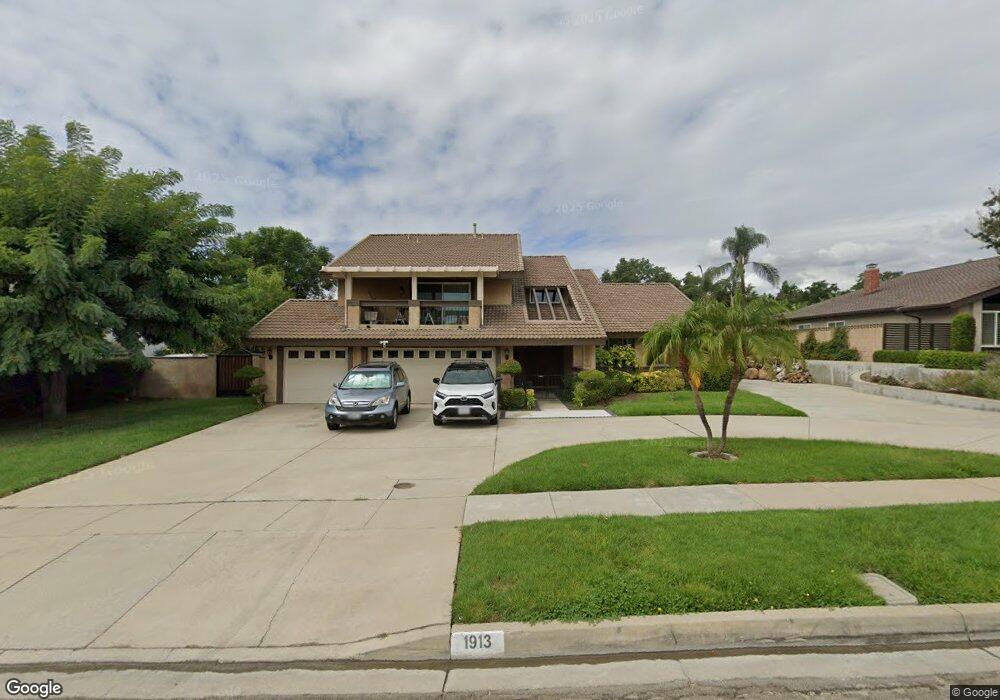
1913 N Tulare Way Upland, CA 91784
Estimated Value: $1,095,788 - $1,293,000
5
Beds
3
Baths
2,854
Sq Ft
$424/Sq Ft
Est. Value
About This Home
This home is located at 1913 N Tulare Way, Upland, CA 91784 and is currently estimated at $1,210,197, approximately $424 per square foot. 1913 N Tulare Way is a home located in San Bernardino County with nearby schools including Magnolia Elementary, Pioneer Junior High School, and Upland High School.
Ownership History
Date
Name
Owned For
Owner Type
Purchase Details
Closed on
May 13, 2009
Sold by
Cook William R
Bought by
Violet Curt M and Violet Kimberly C
Current Estimated Value
Home Financials for this Owner
Home Financials are based on the most recent Mortgage that was taken out on this home.
Original Mortgage
$398,000
Outstanding Balance
$250,245
Interest Rate
4.76%
Mortgage Type
Purchase Money Mortgage
Estimated Equity
$959,952
Purchase Details
Closed on
Mar 31, 1997
Sold by
Laughlin Robert S
Bought by
Cook William R and Cook Cecelia M
Home Financials for this Owner
Home Financials are based on the most recent Mortgage that was taken out on this home.
Original Mortgage
$214,600
Interest Rate
7.96%
Create a Home Valuation Report for This Property
The Home Valuation Report is an in-depth analysis detailing your home's value as well as a comparison with similar homes in the area
Home Values in the Area
Average Home Value in this Area
Purchase History
| Date | Buyer | Sale Price | Title Company |
|---|---|---|---|
| Violet Curt M | $500,000 | Lawyers Title Ie | |
| Cook William R | $239,000 | First American Title Ins Co |
Source: Public Records
Mortgage History
| Date | Status | Borrower | Loan Amount |
|---|---|---|---|
| Open | Violet Curt M | $398,000 | |
| Previous Owner | Cook William R | $214,600 |
Source: Public Records
Tax History Compared to Growth
Tax History
| Year | Tax Paid | Tax Assessment Tax Assessment Total Assessment is a certain percentage of the fair market value that is determined by local assessors to be the total taxable value of land and additions on the property. | Land | Improvement |
|---|---|---|---|---|
| 2025 | $7,209 | $674,606 | $225,359 | $449,247 |
| 2024 | $7,209 | $661,378 | $220,940 | $440,438 |
| 2023 | $7,102 | $648,410 | $216,608 | $431,802 |
| 2022 | $6,950 | $635,696 | $212,361 | $423,335 |
| 2021 | $6,943 | $623,231 | $208,197 | $415,034 |
| 2020 | $6,755 | $616,840 | $206,062 | $410,778 |
| 2019 | $6,732 | $604,746 | $202,022 | $402,724 |
| 2018 | $6,567 | $592,888 | $198,061 | $394,827 |
| 2017 | $6,096 | $554,791 | $194,177 | $360,614 |
| 2016 | $5,865 | $543,913 | $190,370 | $353,543 |
| 2015 | $5,731 | $535,742 | $187,510 | $348,232 |
| 2014 | $5,584 | $525,248 | $183,837 | $341,411 |
Source: Public Records
Map
Nearby Homes
- 256 W 18th St
- 1817 Balboa Way
- 1844 N 1st Ave
- 1761 N Coolcrest Ave
- 1695 N Palm Ave
- 141 W 21st St
- 322 E 19th St
- 1782 N 2nd Ave
- 882 W 17th St
- 211 Deborah Ct
- 1629 N Palm Ave
- 785 W Dalton Ct
- 1623 N Vallejo Way
- 1124 Peppertree Ln
- 2162 N Euclid Ave
- 1226 Azalea Ct
- 1243 Jacaranda Place
- 888 Via Maria
- 1796 Sunnybrook Ave
- 1214 Miller Ct
- 1919 N Tulare Way
- 1903 N Tulare Way
- 1912 N Ukiah Way
- 1904 N Ukiah Way
- 1920 N Ukiah Way
- 1914 N Tulare Way
- 1931 N Tulare Way
- 1920 N Tulare Way
- 1930 N Ukiah Way
- 1930 N Tulare Way
- 580 W 19th St
- 556 W 19th St
- 1896 N Ukiah Way
- 1935 N Tulare Way
- 673 W 19th St
- 1915 N Redding Way
- 1917 N Ukiah Way
- 516 W 19th St
- 1903 N Redding Way
- 1936 N Ukiah Way