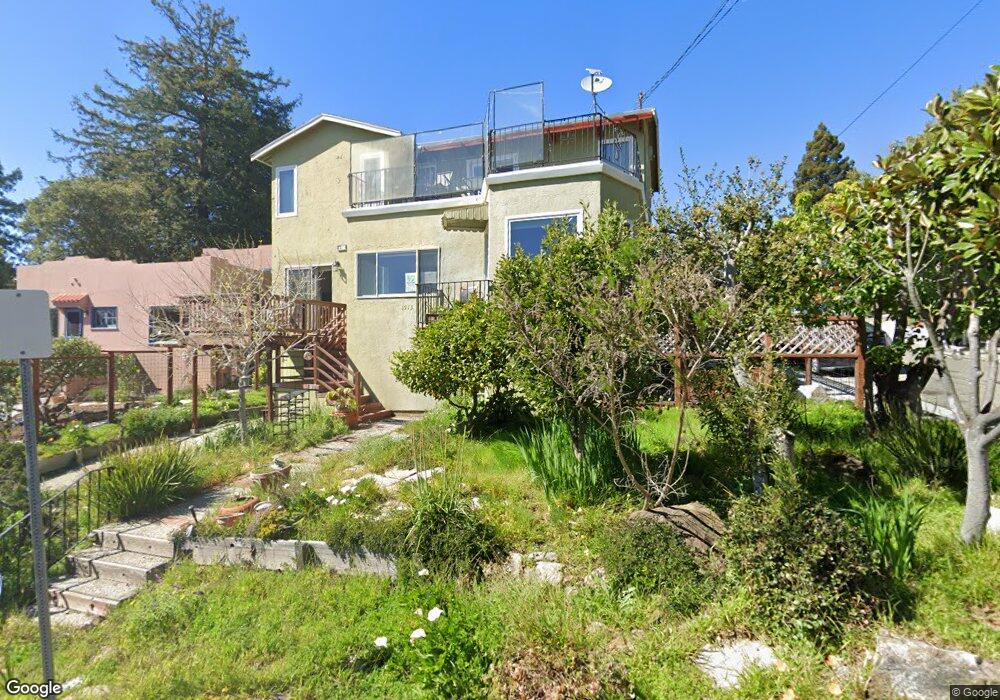
1913 San Antonio Ave Berkeley, CA 94707
Estimated Value: $1,779,000 - $2,270,000
4
Beds
3
Baths
2,629
Sq Ft
$773/Sq Ft
Est. Value
About This Home
This home is located at 1913 San Antonio Ave, Berkeley, CA 94707 and is currently estimated at $2,033,110, approximately $773 per square foot. 1913 San Antonio Ave is a home located in Alameda County with nearby schools including Thousand Oaks Elementary School, Berkeley Arts Magnet at Whittier School, and Ruth Acty Elementary.
Ownership History
Date
Name
Owned For
Owner Type
Purchase Details
Closed on
Jun 17, 2020
Sold by
Sitlani Daniel
Bought by
Sitlani Daniel J and The Daniel J Sitlani 2020 Revo
Current Estimated Value
Purchase Details
Closed on
Jan 16, 2020
Sold by
Sitlani David R and Sitlani Family Trust
Bought by
Sitlani Daniel
Purchase Details
Closed on
Aug 23, 2018
Sold by
Sitlani Alberta and Sitlani Trust
Bought by
Sitlani David R and Sitlani Family Trust
Purchase Details
Closed on
Nov 17, 2006
Sold by
Sitlani Mohanlal W and Sitlani Mohan W
Bought by
Sitlani Mohan W and Sitlani Trust
Purchase Details
Closed on
Nov 8, 1994
Sold by
Sitlani Alberta and Sitlani Mohanlal W
Bought by
Sitlani Mohanlal W
Home Financials for this Owner
Home Financials are based on the most recent Mortgage that was taken out on this home.
Original Mortgage
$140,000
Interest Rate
6.14%
Create a Home Valuation Report for This Property
The Home Valuation Report is an in-depth analysis detailing your home's value as well as a comparison with similar homes in the area
Home Values in the Area
Average Home Value in this Area
Purchase History
| Date | Buyer | Sale Price | Title Company |
|---|---|---|---|
| Sitlani Daniel J | -- | None Available | |
| Sitlani Daniel | -- | None Available | |
| Sitlani David R | -- | None Available | |
| Sitlani Mohan W | -- | None Available | |
| Sitlani Mohanlal W | -- | Fidelity National Title |
Source: Public Records
Mortgage History
| Date | Status | Borrower | Loan Amount |
|---|---|---|---|
| Closed | Sitlani Mohanlal W | $140,000 |
Source: Public Records
Tax History Compared to Growth
Tax History
| Year | Tax Paid | Tax Assessment Tax Assessment Total Assessment is a certain percentage of the fair market value that is determined by local assessors to be the total taxable value of land and additions on the property. | Land | Improvement |
|---|---|---|---|---|
| 2025 | $10,650 | $415,205 | $235,120 | $187,085 |
| 2024 | $10,650 | $406,927 | $230,510 | $183,417 |
| 2023 | $11,242 | $405,812 | $225,991 | $179,821 |
| 2022 | $9,684 | $390,855 | $221,560 | $176,295 |
| 2021 | $9,653 | $383,055 | $217,216 | $172,839 |
| 2020 | $8,957 | $386,056 | $214,989 | $171,067 |
| 2019 | $8,403 | $378,487 | $210,774 | $167,713 |
| 2018 | $8,200 | $371,067 | $206,642 | $164,425 |
| 2017 | $7,897 | $363,793 | $202,591 | $161,202 |
| 2016 | $7,492 | $356,660 | $198,619 | $158,041 |
| 2015 | $7,361 | $351,304 | $195,636 | $155,668 |
| 2014 | $7,192 | $344,423 | $191,804 | $152,619 |
Source: Public Records
Map
Nearby Homes
- 581 Arlington Ave
- 589 San Luis Rd
- 74 Florida Ave
- 744 Coventry Rd
- 716 Coventry Rd
- 85 Stratford Rd
- 715 Santa Barbara Rd
- 411 Vassar Ave
- 256 Cambridge Ave
- 614 Cragmont Ave
- 201 Amherst Ave
- 207 Cambridge Ave
- 1730 San Lorenzo Ave
- 826 Indian Rock Ave
- 680 Grizzly Peak Blvd
- 734 Ensenada Ave
- 971 Santa Barbara Rd
- 1130 Oxford St
- 1909 San Antonio Ave
- 21 Avis Rd
- 1921 San Antonio Ave
- 20 Avis Rd
- 1901 San Antonio Ave
- 589 Arlington Ave
- 27 Avis Rd
- 1910 San Antonio Ave
- 587 Arlington Ave
- 611 Arlington Ave
- 30 Avis Rd
- 1925 San Antonio Ave
- 1918 San Antonio Ave
- 571 Arlington Ave
- 37 Avis Rd
- 615 Arlington Ave
- 40 Avis Rd
- 565 Arlington Ave
- 557 Arlington Ave
- 621 Arlington Ave