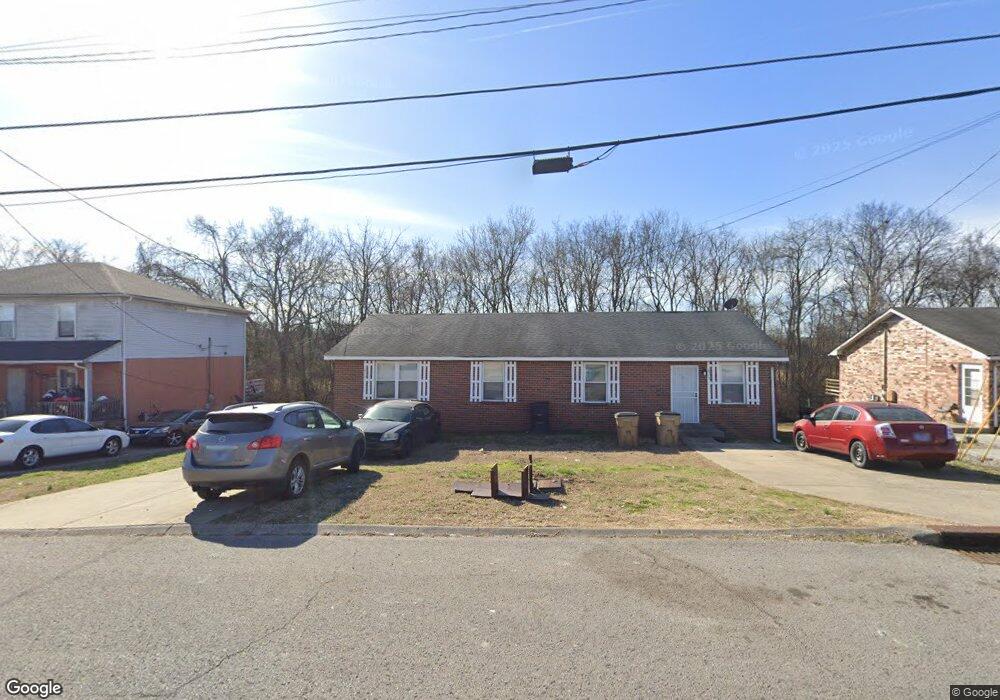
1913 Westchester Dr Nashville, TN 37207
Bellshire Terrace NeighborhoodEstimated Value: $281,000 - $350,000
4
Beds
2
Baths
1,566
Sq Ft
$191/Sq Ft
Est. Value
About This Home
This home is located at 1913 Westchester Dr, Nashville, TN 37207 and is currently estimated at $299,851, approximately $191 per square foot. 1913 Westchester Dr is a home located in Davidson County with nearby schools including Bellshire Elementary Design Center, Madison Middle Prep, and Hunters Lane Comprehensive High School.
Ownership History
Date
Name
Owned For
Owner Type
Purchase Details
Closed on
May 14, 2013
Sold by
Gherghescu Iunian
Bought by
Pandora Properties Llc
Current Estimated Value
Purchase Details
Closed on
Oct 12, 2011
Sold by
Gherghescu Doina
Bought by
Gherghescu Iunian
Purchase Details
Closed on
Feb 11, 2004
Sold by
Iunian Llc
Bought by
Gherghescu Iunian and Gherghescu Doina
Purchase Details
Closed on
Aug 21, 2002
Sold by
Gherghescu Lunian and Gherghescu Lorenta
Bought by
Lunian Llc
Purchase Details
Closed on
Apr 15, 1999
Sold by
Johnson Dennis N and Johnson Sandra A
Bought by
Gherghescu Iunian and Gherghescu Lorenta
Purchase Details
Closed on
May 6, 1998
Sold by
Johnson Dennis N and Johnson Sandra
Bought by
Johnson Dennis N and Johnson Sandra
Purchase Details
Closed on
Oct 20, 1997
Sold by
Sweeney James S
Bought by
Johnson Dennis N and Johnson Chad N
Create a Home Valuation Report for This Property
The Home Valuation Report is an in-depth analysis detailing your home's value as well as a comparison with similar homes in the area
Home Values in the Area
Average Home Value in this Area
Purchase History
| Date | Buyer | Sale Price | Title Company |
|---|---|---|---|
| Pandora Properties Llc | $46,000 | Birthright Title & Escrow Ll | |
| Gherghescu Iunian | -- | None Available | |
| Gherghescu Iunian | -- | -- | |
| Lunian Llc | -- | -- | |
| Gherghescu Iunian | $57,000 | Commonwealth Title Agency | |
| Johnson Dennis N | -- | -- | |
| Johnson Dennis N | $102,000 | Commonwealth Title Agency |
Source: Public Records
Tax History Compared to Growth
Tax History
| Year | Tax Paid | Tax Assessment Tax Assessment Total Assessment is a certain percentage of the fair market value that is determined by local assessors to be the total taxable value of land and additions on the property. | Land | Improvement |
|---|---|---|---|---|
| 2024 | $2,481 | $76,240 | $22,000 | $54,240 |
| 2023 | $2,481 | $76,240 | $22,000 | $54,240 |
| 2022 | $2,481 | $76,240 | $22,000 | $54,240 |
| 2021 | $2,507 | $76,240 | $22,000 | $54,240 |
| 2020 | $1,468 | $38,760 | $9,200 | $29,560 |
| 2019 | $1,068 | $38,760 | $9,200 | $29,560 |
| 2018 | $1,068 | $38,760 | $9,200 | $29,560 |
| 2017 | $1,068 | $38,760 | $9,200 | $29,560 |
| 2016 | $852 | $21,720 | $4,800 | $16,920 |
| 2015 | $852 | $21,720 | $4,800 | $16,920 |
| 2014 | $852 | $21,720 | $4,800 | $16,920 |
Source: Public Records
Map
Nearby Homes
- 3525 Brookway Dr
- 3529 Brookway Dr
- 3946 Northbrook Dr
- 1001 Cone Blvd
- 3625 Brookway Dr
- 1533 Thornton Grove Blvd
- 4108 Walnut Ridge Dr
- 4113 Walnut Ridge Dr
- Birch Plan at Thornton Grove - Single-Family Homes
- Elder Plan at Thornton Grove - Single-Family Homes
- Cedar Plan at Thornton Grove - Single-Family Homes
- Aspen Plan at Thornton Grove - Single-Family Homes
- 4125 Walnut Ridge Dr
- 4105 Walnut Ridge Dr
- 1832 Apple Valley Cir
- 2101 Portway Alley
- 2625 Thornton Grove Blvd
- 4264 Skyridge Dr
- 2665 Thornton Grove Blvd
- 4683 Ridge Bend Dr
- 1909 Westchester Dr
- 1917 Westchester Dr
- 1921 Westchester Dr
- 1905 Westchester Dr
- 3600 Willow Creek Ct
- 1904 Westchester Dr
- 1901 Westchester Dr
- 1920 Westchester Dr
- 3604 Willow Creek Ct
- 3503 Brookway Dr
- 3505 Brookway Dr
- 3605 Willow Creek Ct
- 1829 Westchester Dr
- 1929 Westchester Dr
- 3507 Brookway Dr
- 3610 Willow Creek Ct
- 3700 Willow Creek Rd
- 3609 Willow Creek Ct
- 3509 Brookway Dr