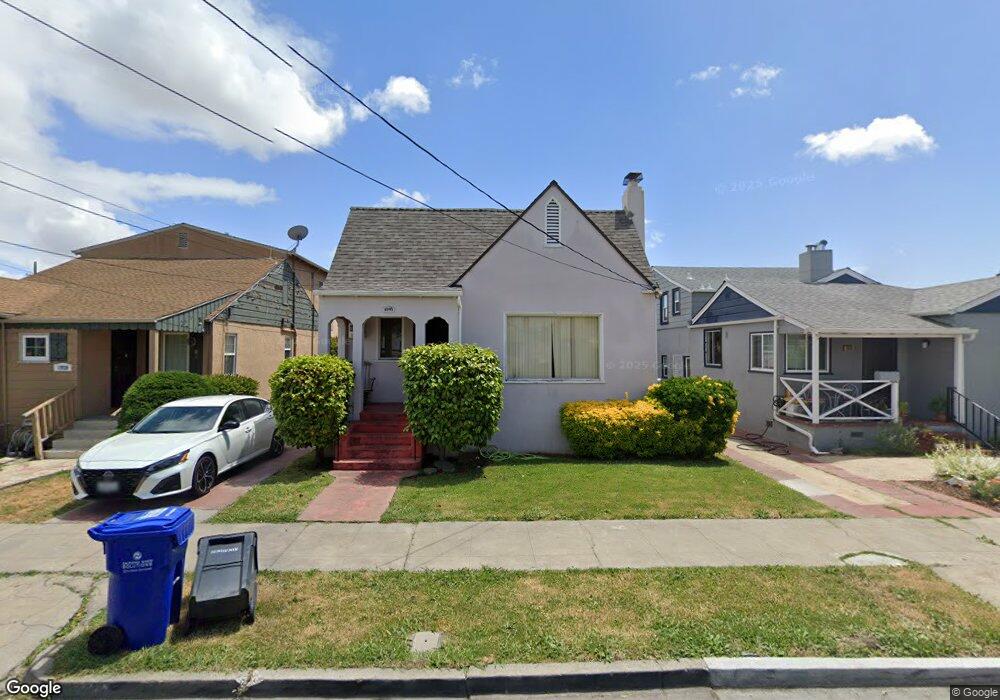
1914 106th Ave Oakland, CA 94603
Durant Manor NeighborhoodEstimated Value: $587,000 - $677,834
2
Beds
2
Baths
1,389
Sq Ft
$456/Sq Ft
Est. Value
About This Home
This home is located at 1914 106th Ave, Oakland, CA 94603 and is currently estimated at $632,959, approximately $455 per square foot. 1914 106th Ave is a home located in Alameda County with nearby schools including Reach Academy, Elmhurst United Middle School, and Madison Park Academy (6-12).
Ownership History
Date
Name
Owned For
Owner Type
Purchase Details
Closed on
Feb 27, 2007
Sold by
Jones Denise L and Jones Daniel Denise
Bought by
Gansah Jacob
Current Estimated Value
Home Financials for this Owner
Home Financials are based on the most recent Mortgage that was taken out on this home.
Original Mortgage
$360,000
Outstanding Balance
$217,067
Interest Rate
6.19%
Mortgage Type
Balloon
Estimated Equity
$415,892
Purchase Details
Closed on
Dec 9, 1999
Sold by
Pettus Viola
Bought by
Daniel Denise L
Home Financials for this Owner
Home Financials are based on the most recent Mortgage that was taken out on this home.
Original Mortgage
$159,000
Interest Rate
7.82%
Mortgage Type
VA
Purchase Details
Closed on
Aug 20, 1999
Sold by
Avaloz Penethia
Bought by
Pettus Viola
Purchase Details
Closed on
Jun 10, 1998
Sold by
Pettus Viola
Bought by
Pettus Viola and Avaloz Penethia
Create a Home Valuation Report for This Property
The Home Valuation Report is an in-depth analysis detailing your home's value as well as a comparison with similar homes in the area
Home Values in the Area
Average Home Value in this Area
Purchase History
| Date | Buyer | Sale Price | Title Company |
|---|---|---|---|
| Gansah Jacob | $450,000 | Chicago Title Company | |
| Daniel Denise L | $160,000 | New Century Title Co | |
| Pettus Viola | -- | -- | |
| Pettus Viola | -- | -- |
Source: Public Records
Mortgage History
| Date | Status | Borrower | Loan Amount |
|---|---|---|---|
| Open | Gansah Jacob | $360,000 | |
| Previous Owner | Daniel Denise L | $159,000 |
Source: Public Records
Tax History Compared to Growth
Tax History
| Year | Tax Paid | Tax Assessment Tax Assessment Total Assessment is a certain percentage of the fair market value that is determined by local assessors to be the total taxable value of land and additions on the property. | Land | Improvement |
|---|---|---|---|---|
| 2025 | $9,209 | $595,855 | $180,856 | $421,999 |
| 2024 | $9,209 | $584,038 | $177,311 | $413,727 |
| 2023 | $9,653 | $579,451 | $173,835 | $405,616 |
| 2022 | $9,394 | $561,093 | $170,428 | $397,665 |
| 2021 | $8,973 | $549,955 | $167,086 | $389,869 |
| 2020 | $8,874 | $551,244 | $165,373 | $385,871 |
| 2019 | $8,535 | $540,440 | $162,132 | $378,308 |
| 2018 | $8,357 | $529,847 | $158,954 | $370,893 |
| 2017 | $7,234 | $460,000 | $138,000 | $322,000 |
| 2016 | $6,762 | $435,000 | $130,500 | $304,500 |
| 2015 | $6,473 | $410,000 | $123,000 | $287,000 |
| 2014 | $4,267 | $245,000 | $73,500 | $171,500 |
Source: Public Records
Map
Nearby Homes
- 1921 106th Ave
- 10786 Eagle Ct
- 1594 Tucker St Unit 56
- 1582 Chandler St Unit 131
- 2014 109th Ave
- 1748 103rd Ave
- 1627 104th Ave
- 1953 102nd Ave
- 2125 102nd Ave
- 1463 103rd Ave
- 2224 107th Ave
- 1362 104th Ave
- 10926 Bancroft Ave
- 10501 Longfellow Ave
- 235 Bancroft Ave
- 10407 Pontiac St
- 1324 104th Ave
- 9425 Sunnyside St
- 9937 Dante Ave
- 10504 Voltaire Ave