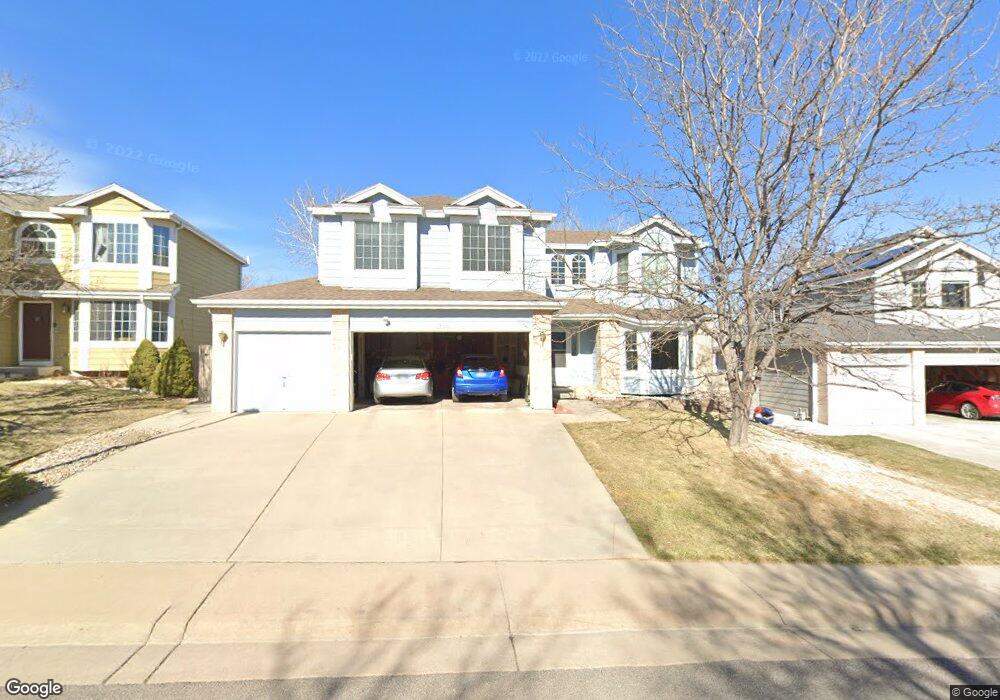
1914 Cedaridge Cir Superior, CO 80027
Estimated Value: $1,018,871 - $1,132,000
4
Beds
4
Baths
3,559
Sq Ft
$304/Sq Ft
Est. Value
About This Home
This home is located at 1914 Cedaridge Cir, Superior, CO 80027 and is currently estimated at $1,081,218, approximately $303 per square foot. 1914 Cedaridge Cir is a home located in Boulder County with nearby schools including Eldorado K-8 School, Superior Elementary School, and Monarch High School.
Ownership History
Date
Name
Owned For
Owner Type
Purchase Details
Closed on
Oct 29, 2010
Sold by
Sanchez Pete T and Sanchez Denise H
Bought by
Jourdan Jeffrey P
Current Estimated Value
Home Financials for this Owner
Home Financials are based on the most recent Mortgage that was taken out on this home.
Original Mortgage
$141,000
Outstanding Balance
$93,267
Interest Rate
4.32%
Mortgage Type
New Conventional
Estimated Equity
$987,951
Purchase Details
Closed on
Nov 30, 1993
Sold by
Richmond Homes Inc Ii
Bought by
Sanchez Pete T
Home Financials for this Owner
Home Financials are based on the most recent Mortgage that was taken out on this home.
Original Mortgage
$166,050
Interest Rate
6.71%
Purchase Details
Closed on
Mar 16, 1993
Bought by
Jourdan Jeffrey P and Lesser Joan B
Purchase Details
Closed on
Jul 23, 1992
Bought by
Jourdan Jeffrey P and Lesser Joan B
Create a Home Valuation Report for This Property
The Home Valuation Report is an in-depth analysis detailing your home's value as well as a comparison with similar homes in the area
Home Values in the Area
Average Home Value in this Area
Purchase History
| Date | Buyer | Sale Price | Title Company |
|---|---|---|---|
| Jourdan Jeffrey P | $466,000 | Guardian Title | |
| Sanchez Pete T | $208,373 | Land Title | |
| Jourdan Jeffrey P | -- | -- | |
| Jourdan Jeffrey P | -- | -- |
Source: Public Records
Mortgage History
| Date | Status | Borrower | Loan Amount |
|---|---|---|---|
| Open | Jourdan Jeffrey P | $141,000 | |
| Previous Owner | Sanchez Pete T | $166,050 |
Source: Public Records
Tax History Compared to Growth
Tax History
| Year | Tax Paid | Tax Assessment Tax Assessment Total Assessment is a certain percentage of the fair market value that is determined by local assessors to be the total taxable value of land and additions on the property. | Land | Improvement |
|---|---|---|---|---|
| 2025 | $6,475 | $61,582 | $22,288 | $39,294 |
| 2024 | $6,475 | $61,582 | $22,288 | $39,294 |
| 2023 | $6,386 | $62,484 | $19,698 | $46,471 |
| 2022 | $4,944 | $47,260 | $15,742 | $31,518 |
| 2021 | $5,223 | $51,724 | $17,232 | $34,492 |
| 2020 | $4,929 | $46,911 | $17,732 | $29,179 |
| 2019 | $4,860 | $46,911 | $17,732 | $29,179 |
| 2018 | $4,425 | $42,307 | $12,240 | $30,067 |
| 2017 | $4,523 | $46,773 | $13,532 | $33,241 |
| 2016 | $4,558 | $41,185 | $12,656 | $28,529 |
| 2015 | $4,331 | $35,987 | $13,452 | $22,535 |
| 2014 | $3,821 | $35,987 | $13,452 | $22,535 |
Source: Public Records
Map
Nearby Homes
- 1812 Eldorado Dr
- 2112 Grayden Ct
- 1899 Breen Ln
- 1842 Reliance Cir
- 1637 Reliance Cir
- 1825 Keota Ln
- 1302 Eldorado Dr
- 2204 Lasalle St
- 1122 Eldorado Dr
- 1009 Monarch Way
- 1815 Spaulding Cir Unit 1815
- 2169 Eagle Ave Unit 2169
- 888 Northern Way
- 977 Eldorado Dr
- 882 Eldorado Dr
- 1220 S Boyero Ct
- 1820 Vernon Ln
- 1485 Stoneham St
- 2225 Clayton Cir
- 1340 Stoneham St
- 1904 Cedaridge Cir
- 1924 Cedaridge Cir
- 1927 Eldorado Dr
- 1947 Eldorado Dr
- 1884 Cedaridge Cir
- 1934 Cedaridge Cir
- 1917 Eldorado Dr
- 1967 Eldorado Dr
- 1919 Cedaridge Cir
- 1929 Cedaridge Cir
- 1907 Eldorado Dr
- 1987 Eldorado Dr
- 1874 Cedaridge Cir
- 1944 Cedaridge Cir
- 1899 Cedaridge Cir
- 1949 Cedaridge Cir
- 1897 Eldorado Dr
- 1997 Eldorado Dr
- 1954 Cedaridge Cir
- 1889 Cedaridge Cir