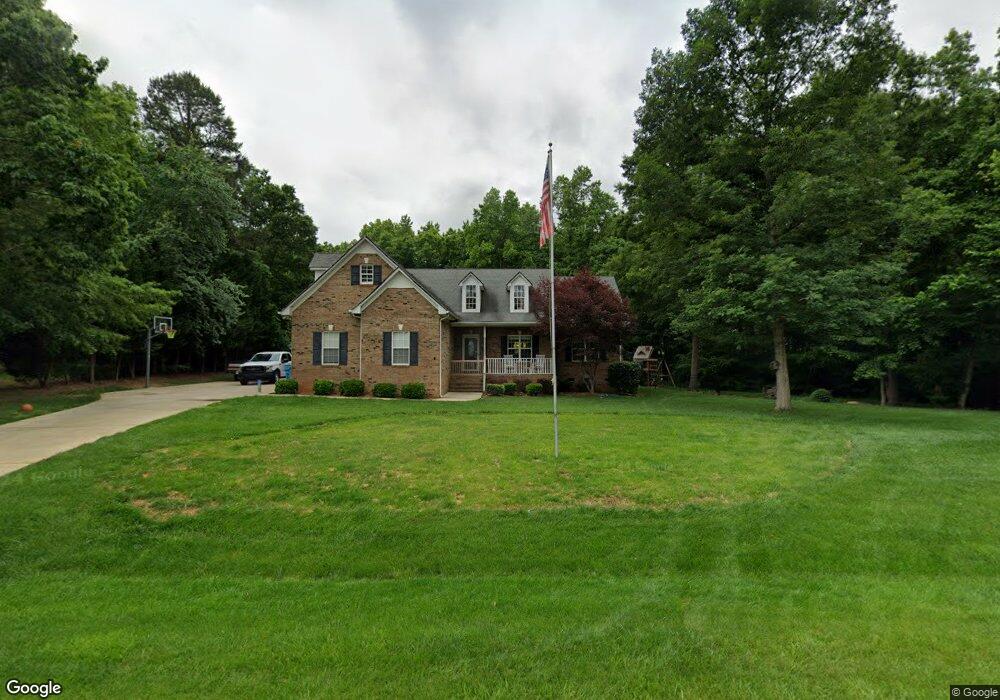
1914 Crossbridge Dr Monroe, NC 28112
Estimated Value: $455,000 - $498,231
3
Beds
2
Baths
1,860
Sq Ft
$253/Sq Ft
Est. Value
About This Home
This home is located at 1914 Crossbridge Dr, Monroe, NC 28112 and is currently estimated at $471,308, approximately $253 per square foot. 1914 Crossbridge Dr is a home located in Union County with nearby schools including Western Union Elementary School, Parkwood Middle School, and Parkwood High School.
Ownership History
Date
Name
Owned For
Owner Type
Purchase Details
Closed on
Aug 6, 2015
Sold by
Tinkle Rickey and Tinkle Donna
Bought by
Ward Rosemary W and Ward Sandy S
Current Estimated Value
Home Financials for this Owner
Home Financials are based on the most recent Mortgage that was taken out on this home.
Original Mortgage
$168,000
Outstanding Balance
$131,680
Interest Rate
4.09%
Mortgage Type
New Conventional
Estimated Equity
$339,628
Purchase Details
Closed on
Jul 9, 2012
Sold by
Federal National Mortgage Association
Bought by
Tinkle Rickey
Purchase Details
Closed on
Jan 3, 2012
Sold by
Dye Danny L and Dye Tina M
Bought by
Federal National Mortgage Association
Purchase Details
Closed on
Jul 28, 2005
Sold by
Allisons Custom Construction Llc
Bought by
Dye Danny L and Dye Tina M
Home Financials for this Owner
Home Financials are based on the most recent Mortgage that was taken out on this home.
Original Mortgage
$167,600
Interest Rate
5.59%
Mortgage Type
Fannie Mae Freddie Mac
Create a Home Valuation Report for This Property
The Home Valuation Report is an in-depth analysis detailing your home's value as well as a comparison with similar homes in the area
Purchase History
| Date | Buyer | Sale Price | Title Company |
|---|---|---|---|
| Ward Rosemary W | $210,000 | Investors Title | |
| Tinkle Rickey | -- | None Available | |
| Federal National Mortgage Association | $242,968 | None Available | |
| Dye Danny L | $209,500 | -- |
Source: Public Records
Mortgage History
| Date | Status | Borrower | Loan Amount |
|---|---|---|---|
| Open | Ward Rosemary W | $168,000 | |
| Previous Owner | Dye Danny L | $167,600 |
Source: Public Records
Tax History
| Year | Tax Paid | Tax Assessment Tax Assessment Total Assessment is a certain percentage of the fair market value that is determined by local assessors to be the total taxable value of land and additions on the property. | Land | Improvement |
|---|---|---|---|---|
| 2025 | $2,368 | $491,600 | $0 | $0 |
| 2024 | $1,956 | $304,100 | $50,500 | $253,600 |
| 2023 | $1,929 | $304,100 | $50,500 | $253,600 |
| 2022 | $1,929 | $304,100 | $50,500 | $253,600 |
| 2021 | $1,916 | $304,100 | $50,500 | $253,600 |
| 2020 | $1,934 | $250,800 | $36,500 | $214,300 |
| 2019 | $1,972 | $250,800 | $36,500 | $214,300 |
| 2018 | $1,972 | $250,800 | $36,500 | $214,300 |
| 2017 | $2,101 | $250,800 | $36,500 | $214,300 |
| 2016 | $1,819 | $224,500 | $36,500 | $188,000 |
| 2015 | $1,850 | $224,500 | $36,500 | $188,000 |
| 2014 | $1,313 | $188,580 | $34,000 | $154,580 |
Source: Public Records
Map
Nearby Homes
- 3211 Lancaster Hwy
- 3018 Corinth Church Rd
- 0 White Oaks Cir Unit 41-44 CAR4254996
- 2608 Corinth Church Rd
- 2503 Lancaster Hwy
- 00 Doster Rd
- 715 White Oaks Cir
- 1103 White Oaks Cir
- 2407 Plyler Mill Rd
- 2409 Plyler Mill Rd
- 0 Avery Parker Rd
- 3808 Forty Acre Dr
- 3607 Roughedge Dr
- 3610 Roughedge Dr
- 2303 Long Hope Rd
- 3511 Oasis Dr
- 3517 Oasis Dr
- 0 Lancaster Hwy
- 3706 Roughedge Dr
- 00 Lancaster Ave
- 2215 Courtyard Ln
- 1910 Crossbridge Dr
- 2219 Courtyard Ln
- 1922 Crossbridge Dr
- 1913 Crossbridge Dr
- 1917 Crossbridge Dr
- 2209 Courtyard Ln
- 2209 Courtyard Ln Unit 19
- 2220 Courtyard Ln
- 1900 Crossbridge Dr
- 1909 Crossbridge Dr
- 2216 Courtyard Ln
- 1923 Crossbridge Dr
- 2206 Doster Rd
- 1905 Crossbridge Dr
- 2208 Courtyard Ln
- 2118 Doster Rd
- 2210 Doster Rd
- 2200 Courtyard Ln
- 2204 Courtyard Ln
Your Personal Tour Guide
Ask me questions while you tour the home.