19143 Smith Ln Redding, CA 96002
Estimated Value: $337,598 - $355,000
3
Beds
2
Baths
1,500
Sq Ft
$232/Sq Ft
Est. Value
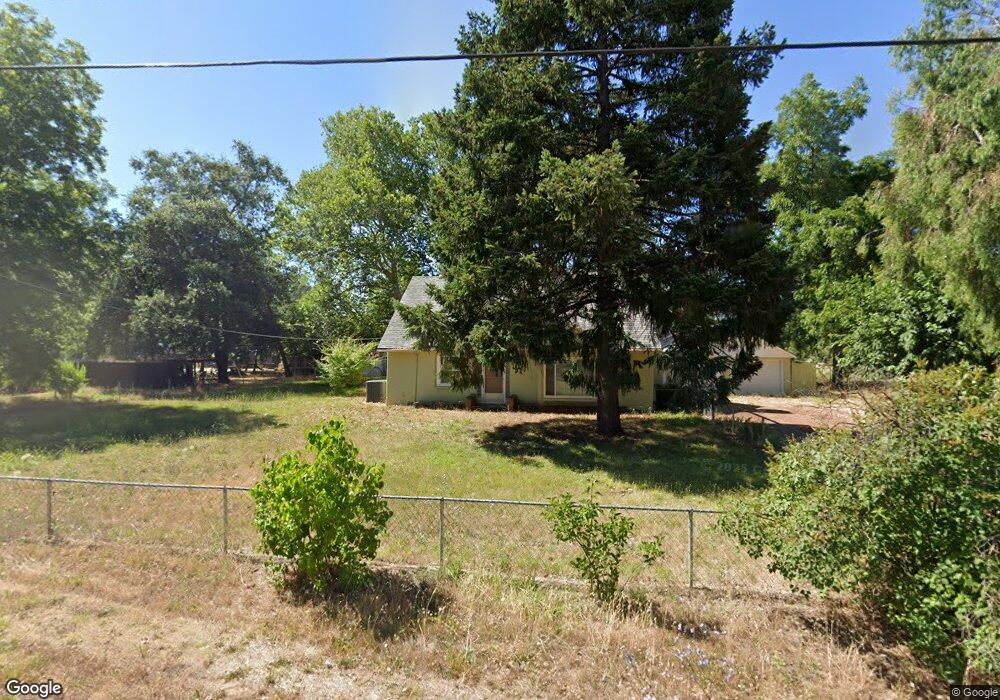
About This Home
This home is located at 19143 Smith Ln, Redding, CA 96002 and is currently estimated at $347,650, approximately $231 per square foot. 19143 Smith Ln is a home located in Shasta County with nearby schools including Prairie Elementary School, Pacheco Elementary School, and Pace Academy.
Ownership History
Date
Name
Owned For
Owner Type
Purchase Details
Closed on
Feb 28, 2017
Sold by
Allen Keith and Allen Cartherine Darling
Bought by
Len Keith A and Allen Catherine
Current Estimated Value
Purchase Details
Closed on
Dec 5, 2013
Sold by
Allen Edward L and Allen Beverly J
Bought by
Allen Keith and Allen Catherine Darling
Home Financials for this Owner
Home Financials are based on the most recent Mortgage that was taken out on this home.
Original Mortgage
$140,000
Outstanding Balance
$104,101
Interest Rate
4.08%
Mortgage Type
Seller Take Back
Estimated Equity
$243,549
Purchase Details
Closed on
Mar 24, 2010
Sold by
Davis Mary L and Catherine Davis M
Bought by
Allen Edward L and Allen Beverly J
Purchase Details
Closed on
Jun 14, 2007
Sold by
Davis Mary L and Catherine Davis M
Bought by
Davis Mary L
Purchase Details
Closed on
Jan 19, 2005
Sold by
Davis Mary L
Bought by
Davis Mary L and Catherine Davis M
Purchase Details
Closed on
Mar 24, 2004
Sold by
Davis Wiley D and Davis Mary L
Bought by
Davis Mary L
Create a Home Valuation Report for This Property
The Home Valuation Report is an in-depth analysis detailing your home's value as well as a comparison with similar homes in the area
Purchase History
| Date | Buyer | Sale Price | Title Company |
|---|---|---|---|
| Len Keith A | -- | None Available | |
| Allen Keith | $150,000 | First American Title Company | |
| Allen Edward L | -- | None Available | |
| Davis Mary L | -- | Alliance Title Company | |
| Davis Mary L | -- | -- | |
| Davis Mary L | -- | -- |
Source: Public Records
Mortgage History
| Date | Status | Borrower | Loan Amount |
|---|---|---|---|
| Open | Allen Keith | $140,000 |
Source: Public Records
Tax History
| Year | Tax Paid | Tax Assessment Tax Assessment Total Assessment is a certain percentage of the fair market value that is determined by local assessors to be the total taxable value of land and additions on the property. | Land | Improvement |
|---|---|---|---|---|
| 2025 | $2,002 | $194,369 | $61,288 | $133,081 |
| 2024 | $1,842 | $191,685 | $60,087 | $131,598 |
| 2023 | $1,842 | $176,731 | $58,909 | $117,822 |
| 2022 | $1,794 | $173,266 | $57,754 | $115,512 |
| 2021 | $1,764 | $169,870 | $56,622 | $113,248 |
| 2020 | $1,742 | $168,129 | $56,042 | $112,087 |
| 2019 | $1,718 | $164,834 | $54,944 | $109,890 |
| 2018 | $1,649 | $161,603 | $53,867 | $107,736 |
| 2017 | $1,671 | $158,435 | $52,811 | $105,624 |
| 2016 | $1,579 | $155,329 | $51,776 | $103,553 |
| 2015 | $1,576 | $152,997 | $50,999 | $101,998 |
| 2014 | $1,556 | $150,681 | $50,227 | $100,454 |
Source: Public Records
Map
Nearby Homes
- 19278 Green Acres Ln W
- 19233 W Niles Ln
- 7035 Riverside Dr
- 6958 Riverside Dr
- 6681 Riverside Dr
- 3182 Island Dr
- 19577 Medo Vale Ln
- 6725 Reflection St
- 5521 Churn Creek Rd
- 7605 Churn Creek Rd
- 5717 Churn Creek Rd
- 99999 Churn Creek Rd
- 19301 Clover Rd
- 6871 Hemlock St
- 2000 Spur Ct
- 0 Villa Ct
- 2850 Balaton Ave
- 7022 Marvin Trail
- 7420 Platinum Way
- 5551 Ebon
- 19147 Smith Ln
- 19133 Smith Ln
- 19087 Smith Ln
- 19157 Smith Ln
- 19178 Gravel Plant Rd
- 19150 Smith Ln
- 19151 Gravel Plant Rd
- 19186 Gravel Plant Rd
- 19159 Gravel Plant Rd
- 19153 Smith Ln
- 7887 Greenfield St
- 19103 Smith Rd
- 19167 Gravel Plant Rd
- 7924 Greenfield St
- 19188 Gravel Plant Rd
- 7944 Greenfield St
- 19179 Gravel Plant Rd
- 19084 Gravel Plant Rd
- 19132 Smith Rd
- 19199 Gravel Plant Rd
Your Personal Tour Guide
Ask me questions while you tour the home.