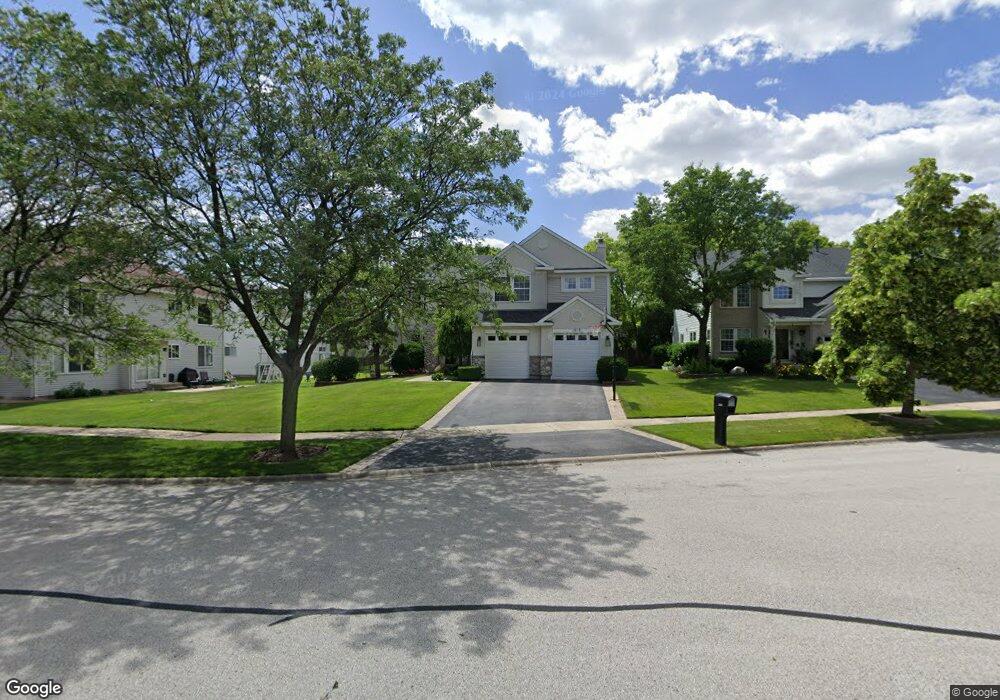
1915 Tufton Ct Naperville, IL 60564
Springbrook Prairie NeighborhoodEstimated Value: $665,000 - $737,000
4
Beds
3
Baths
2,620
Sq Ft
$265/Sq Ft
Est. Value
About This Home
This home is located at 1915 Tufton Ct, Naperville, IL 60564 and is currently estimated at $693,142, approximately $264 per square foot. 1915 Tufton Ct is a home located in DuPage County with nearby schools including Welch Elementary School, Scullen Middle School, and Neuqua Valley High School.
Ownership History
Date
Name
Owned For
Owner Type
Purchase Details
Closed on
Jun 11, 2010
Sold by
Majors Christopher J and Majors Yolanda J
Bought by
Jain Shobhit and Jain Supna P
Current Estimated Value
Home Financials for this Owner
Home Financials are based on the most recent Mortgage that was taken out on this home.
Original Mortgage
$270,400
Interest Rate
4.36%
Mortgage Type
New Conventional
Purchase Details
Closed on
Nov 24, 2003
Sold by
Euritt R Jeffery and Euritt Susan Salem
Bought by
Majors Christopher J and Majors Yolanda J
Home Financials for this Owner
Home Financials are based on the most recent Mortgage that was taken out on this home.
Original Mortgage
$280,000
Interest Rate
6.1%
Mortgage Type
Purchase Money Mortgage
Create a Home Valuation Report for This Property
The Home Valuation Report is an in-depth analysis detailing your home's value as well as a comparison with similar homes in the area
Home Values in the Area
Average Home Value in this Area
Purchase History
| Date | Buyer | Sale Price | Title Company |
|---|---|---|---|
| Jain Shobhit | $338,000 | Multiple | |
| Majors Christopher J | $350,000 | -- |
Source: Public Records
Mortgage History
| Date | Status | Borrower | Loan Amount |
|---|---|---|---|
| Previous Owner | Jain Shobhit | $270,400 | |
| Previous Owner | Majors Christopher J | $280,000 | |
| Closed | Majors Christopher J | $35,000 |
Source: Public Records
Tax History
| Year | Tax Paid | Tax Assessment Tax Assessment Total Assessment is a certain percentage of the fair market value that is determined by local assessors to be the total taxable value of land and additions on the property. | Land | Improvement |
|---|---|---|---|---|
| 2024 | $11,040 | $184,864 | $45,740 | $139,124 |
| 2023 | $10,572 | $166,110 | $41,100 | $125,010 |
| 2022 | $10,079 | $154,790 | $37,990 | $116,800 |
| 2021 | $9,761 | $149,260 | $36,630 | $112,630 |
| 2020 | $9,747 | $149,260 | $36,630 | $112,630 |
| 2019 | $9,363 | $141,960 | $34,840 | $107,120 |
| 2018 | $9,882 | $145,600 | $36,270 | $109,330 |
| 2017 | $9,610 | $140,660 | $35,040 | $105,620 |
| 2016 | $9,436 | $134,990 | $33,630 | $101,360 |
| 2015 | $9,348 | $128,170 | $31,930 | $96,240 |
| 2014 | $8,401 | $111,980 | $28,700 | $83,280 |
| 2013 | $8,383 | $112,760 | $28,900 | $83,860 |
Source: Public Records
Map
Nearby Homes
- 2732 Flagstone Cir
- 9S271 Stearman Dr
- 9S321 Chandelle Dr
- 2835 Rutland Cir Unit 202
- 2204 Waterleaf Ct Unit CT104
- 1517 Pine Lake Dr
- 1512 Harbour Towne Place
- 1503 Wexford Place
- 4429 Chelsea Manor Cir
- 4005 White Eagle Dr
- 4515 Chelsea Manor Cir
- 4167 Chelsea Manor Cir
- 4204 Chelsea Manor Cir
- 2503 Skylane Dr
- 2311 Leverenz Rd
- 4122 Chelsea Manor Cir
- 4196 Irving Rd
- 4177 Irving Rd
- 3942 Broadmoor Cir
- 4110 Chelsea Manor Cir
- 1911 Tufton Ct
- 2735 Flagstone Cir
- 2739 Flagstone Cir
- 2763 Flagstone Cir
- 2759 Flagstone Cir
- 2767 Flagstone Cir
- 1907 Tufton Ct
- 2755 Flagstone Cir
- 2771 Flagstone Cir
- 2719 Flagstone Cir
- 1912 Tufton Ct
- 1903 Tufton Ct
- 2775 Flagstone Cir
- 1908 Tufton Ct
- 1904 Tufton Ct
- 2715 Flagstone Cir
- 2779 Flagstone Cir
- 2736 Flagstone Cir
- 2740 Flagstone Cir
- 2764 Flagstone Cir
Your Personal Tour Guide
Ask me questions while you tour the home.