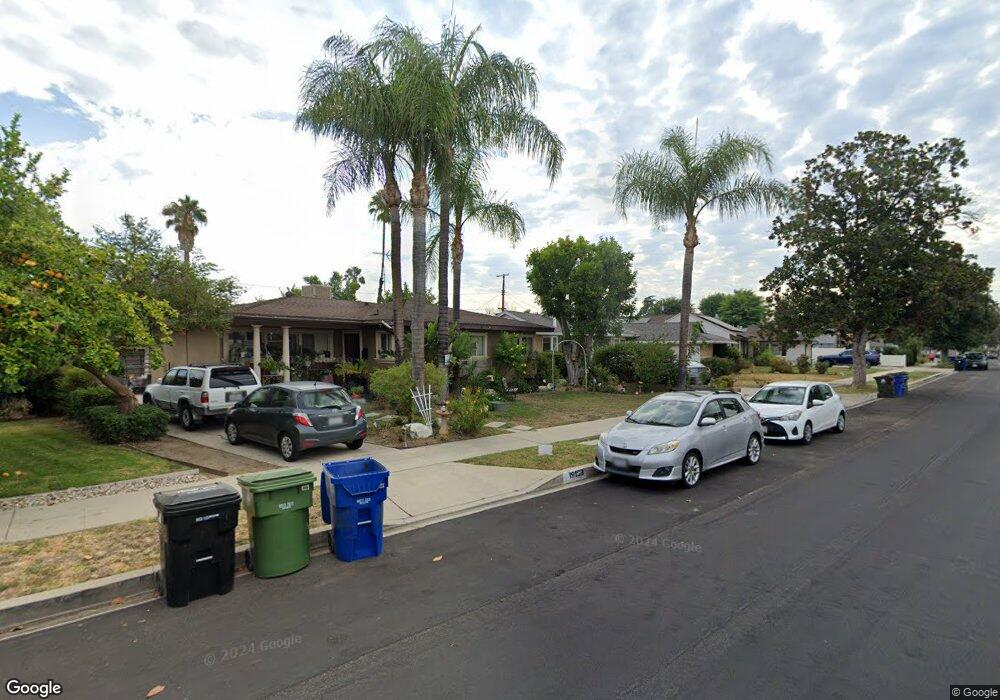
19159 Calvert St Tarzana, CA 91335
Estimated Value: $874,000 - $1,063,000
4
Beds
2
Baths
1,521
Sq Ft
$624/Sq Ft
Est. Value
About This Home
This home is located at 19159 Calvert St, Tarzana, CA 91335 and is currently estimated at $949,337, approximately $624 per square foot. 19159 Calvert St is a home located in Los Angeles County with nearby schools including Vanalden Avenue Elementary, Gaspar De Portola Middle School, and Calvert Charter for Enriched Studies.
Ownership History
Date
Name
Owned For
Owner Type
Purchase Details
Closed on
Apr 15, 1994
Sold by
Federal Home Loan Mortgage Corporation
Bought by
Brett Jerry and Brett Hilary
Current Estimated Value
Home Financials for this Owner
Home Financials are based on the most recent Mortgage that was taken out on this home.
Original Mortgage
$131,100
Interest Rate
7.79%
Purchase Details
Closed on
Aug 31, 1993
Sold by
Professional Foreclosure Corp
Bought by
Federal Home Loan Mortgage Corporation
Create a Home Valuation Report for This Property
The Home Valuation Report is an in-depth analysis detailing your home's value as well as a comparison with similar homes in the area
Home Values in the Area
Average Home Value in this Area
Purchase History
| Date | Buyer | Sale Price | Title Company |
|---|---|---|---|
| Brett Jerry | $138,000 | Fidelity National Title Ins | |
| Federal Home Loan Mortgage Corporation | $227,512 | First Southwestern Title |
Source: Public Records
Mortgage History
| Date | Status | Borrower | Loan Amount |
|---|---|---|---|
| Closed | Brett Jerry | $131,100 |
Source: Public Records
Tax History Compared to Growth
Tax History
| Year | Tax Paid | Tax Assessment Tax Assessment Total Assessment is a certain percentage of the fair market value that is determined by local assessors to be the total taxable value of land and additions on the property. | Land | Improvement |
|---|---|---|---|---|
| 2025 | $3,406 | $271,745 | $148,537 | $123,208 |
| 2024 | $3,406 | $266,418 | $145,625 | $120,793 |
| 2023 | $3,343 | $261,195 | $142,770 | $118,425 |
| 2022 | $3,191 | $256,074 | $139,971 | $116,103 |
| 2021 | $3,144 | $251,054 | $137,227 | $113,827 |
| 2019 | $3,052 | $243,608 | $133,157 | $110,451 |
| 2018 | $2,950 | $238,833 | $130,547 | $108,286 |
| 2016 | $2,804 | $229,561 | $125,479 | $104,082 |
| 2015 | $2,763 | $226,114 | $123,595 | $102,519 |
| 2014 | $2,779 | $221,685 | $121,174 | $100,511 |
Source: Public Records
Map
Nearby Homes
- 19138 Topham St
- 19246 Liam Ln
- 6250 Tunney Ave
- 19434 Calvert St
- 19419 Oxnard St
- 19324 Victory Blvd
- 19323 Lavi Ct
- 18933 Friar St
- 5832 Calvin Ave
- 5828 Calvin Ave
- 6263 Crebs Ave
- 5460 Aura Ave
- 18843 Hatteras St Unit 2
- 5712 Donna Ave
- 18854 Hatteras St
- 6511 Wystone Ave Unit 4
- 19041 Hamlin St Unit 5
- 6526 Vanalden Ave Unit 7
- 19036 Kittridge St Unit 1
- 18751 Hatteras St Unit 13
- 19165 Calvert St
- 19153 Calvert St
- 19160 Delano St
- 19154 Delano St
- 19147 Calvert St
- 19168 Delano St
- 6140 Beckford Ave
- 19148 Delano St
- 6146 Beckford Ave
- 19162 Calvert St
- 19168 Calvert St
- 19156 Calvert St
- 19141 Calvert St
- 19140 Delano St
- 19200 Calvert St
- 6152 Beckford Ave
- 19150 Calvert St
- 19204 Calvert St
- 19144 Calvert St
- 19157 Delano St