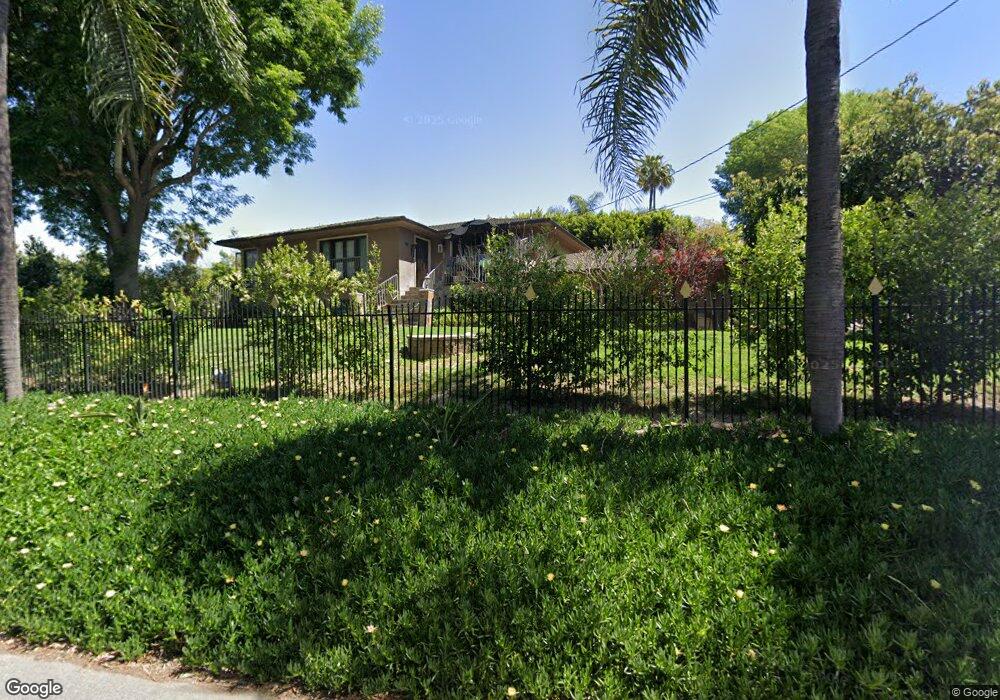
1916 Tumin Rd La Habra Heights, CA 90631
Estimated Value: $998,394 - $1,254,000
3
Beds
2
Baths
1,472
Sq Ft
$736/Sq Ft
Est. Value
About This Home
This home is located at 1916 Tumin Rd, La Habra Heights, CA 90631 and is currently estimated at $1,084,099, approximately $736 per square foot. 1916 Tumin Rd is a home located in Los Angeles County with nearby schools including El Portal Elementary School, Rancho-Starbuck Intermediate School, and Sonora High School.
Ownership History
Date
Name
Owned For
Owner Type
Purchase Details
Closed on
Apr 24, 2008
Sold by
Farina Paul Michael and Farina Vanessa Brittney
Bought by
Farina Paul Michael and Farina Vanessa Brittney
Current Estimated Value
Home Financials for this Owner
Home Financials are based on the most recent Mortgage that was taken out on this home.
Original Mortgage
$417,000
Outstanding Balance
$261,940
Interest Rate
5.81%
Mortgage Type
New Conventional
Estimated Equity
$822,159
Purchase Details
Closed on
Nov 15, 2001
Sold by
Farina Paul and Farina Vanessa
Bought by
Farina Paul Michael and Farina Vanessa Brittney
Purchase Details
Closed on
Jan 30, 1997
Sold by
Farina Cecilia
Bought by
Farina Pablo
Purchase Details
Closed on
Apr 28, 1994
Sold by
Willison David F and Willison Patricia K
Bought by
Farina Pablo and Farina Cecilia
Home Financials for this Owner
Home Financials are based on the most recent Mortgage that was taken out on this home.
Original Mortgage
$265,500
Interest Rate
8.56%
Create a Home Valuation Report for This Property
The Home Valuation Report is an in-depth analysis detailing your home's value as well as a comparison with similar homes in the area
Home Values in the Area
Average Home Value in this Area
Purchase History
| Date | Buyer | Sale Price | Title Company |
|---|---|---|---|
| Farina Paul Michael | -- | Accommodation | |
| Farina Paul Michael | -- | First American Title Company | |
| Farina Paul Michael | -- | -- | |
| Farina Pablo | -- | -- | |
| Farina Pablo | $295,000 | World Title |
Source: Public Records
Mortgage History
| Date | Status | Borrower | Loan Amount |
|---|---|---|---|
| Open | Farina Paul Michael | $417,000 | |
| Previous Owner | Farina Pablo | $265,500 |
Source: Public Records
Tax History Compared to Growth
Tax History
| Year | Tax Paid | Tax Assessment Tax Assessment Total Assessment is a certain percentage of the fair market value that is determined by local assessors to be the total taxable value of land and additions on the property. | Land | Improvement |
|---|---|---|---|---|
| 2025 | $6,410 | $501,381 | $315,110 | $186,271 |
| 2024 | $6,410 | $491,551 | $308,932 | $182,619 |
| 2023 | $6,264 | $481,914 | $302,875 | $179,039 |
| 2022 | $6,187 | $472,466 | $296,937 | $175,529 |
| 2021 | $6,048 | $463,203 | $291,115 | $172,088 |
| 2019 | $5,880 | $449,466 | $282,481 | $166,985 |
| 2018 | $5,555 | $440,654 | $276,943 | $163,711 |
| 2016 | $5,109 | $423,544 | $266,190 | $157,354 |
| 2015 | $4,916 | $417,183 | $262,192 | $154,991 |
| 2014 | $4,974 | $409,012 | $257,057 | $151,955 |
Source: Public Records
Map
Nearby Homes
- 1929 Coban Rd
- 2240 Valle Dr
- 0 Airoso Rd
- 1573 Nabal Rd
- 918 Dorothea Rd
- 927 E Avocado Crest Rd
- 1500 Kashlan Rd
- 918 Reposado Dr
- 1445 Darlene Dr
- 739 Reposado Dr
- 1944 Chandos Ln
- 506 Dorothea Rd
- 161 W Hidden Ln
- 171 Canada Sombre Rd
- 220 Olinda Ave
- 1241 Arbolita Dr
- 105 Reposado Dr
- 18109 Graystone Way
- 1100 N Euclid St
- 1620 El Travesia Dr
- 1930 Tumin Rd
- 1914 Tumin Rd
- 1276 East Rd
- 0 Tumin Unit PW17239116
- 0 Tumin Unit P803597
- 0 Tumin Unit P806687
- 0 Tumin` Unit PW13022644
- 0 Tumin Unit WS14155614
- 0 Tumin Unit PW14246065
- 0 Tumin Unit PW16112729
- 0 Tumin Unit PW17042194
- 0 Tumin Unit PW22251638
- 0 Tumin Unit PW22151870
- 0 Tumin Unit 220010547
- 1950 Tumin Rd
- 1963 Tumin Rd
- 1900 Tumin Rd
- 1336 Caminata Ln
- 1917 Tumin Rd
- 1912 Tumin Rd