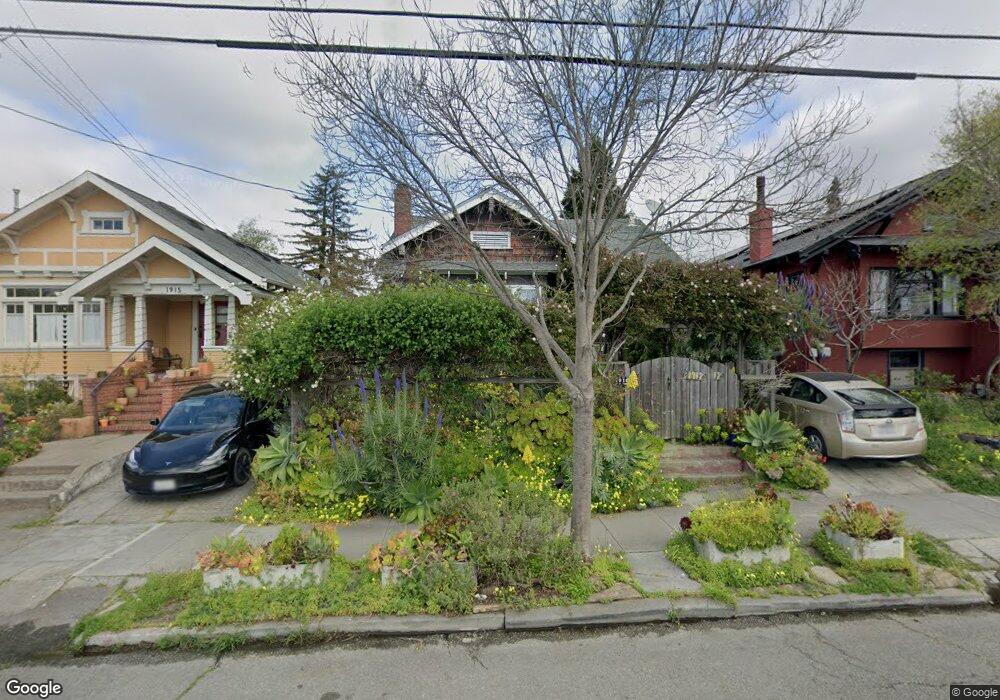
1917 Carleton St Berkeley, CA 94704
South Berkeley NeighborhoodEstimated Value: $1,154,000 - $1,271,926
3
Beds
2
Baths
1,504
Sq Ft
$797/Sq Ft
Est. Value
About This Home
This home is located at 1917 Carleton St, Berkeley, CA 94704 and is currently estimated at $1,197,982, approximately $796 per square foot. 1917 Carleton St is a home located in Alameda County with nearby schools including Malcolm X Elementary School, Emerson Elementary School, and John Muir Elementary School.
Ownership History
Date
Name
Owned For
Owner Type
Purchase Details
Closed on
Jul 13, 2012
Sold by
Fredman Peter
Bought by
Fredman Peter and Monti Lily
Current Estimated Value
Home Financials for this Owner
Home Financials are based on the most recent Mortgage that was taken out on this home.
Original Mortgage
$487,500
Outstanding Balance
$335,876
Interest Rate
3.63%
Mortgage Type
New Conventional
Estimated Equity
$862,106
Purchase Details
Closed on
Apr 28, 2003
Sold by
Gribi Ernest Lee
Bought by
Fredman Peter
Home Financials for this Owner
Home Financials are based on the most recent Mortgage that was taken out on this home.
Original Mortgage
$384,000
Interest Rate
5.77%
Mortgage Type
Purchase Money Mortgage
Purchase Details
Closed on
Feb 3, 1998
Sold by
Gribi Jeannette
Bought by
Gribi Jeanette and 1998 Jeanette Gribi Trust
Purchase Details
Closed on
Sep 9, 1996
Sold by
Gribi Jeanette
Bought by
Gribi Jeanette and Jeanette Gribi Trust
Create a Home Valuation Report for This Property
The Home Valuation Report is an in-depth analysis detailing your home's value as well as a comparison with similar homes in the area
Home Values in the Area
Average Home Value in this Area
Purchase History
| Date | Buyer | Sale Price | Title Company |
|---|---|---|---|
| Fredman Peter | -- | Servicelink | |
| Fredman Peter | $480,500 | Old Republic Title Company | |
| Gribi Ernest Lee | -- | Old Republic Title Company | |
| Gribi Jeanette | -- | -- | |
| Gribi Jeanette | -- | -- |
Source: Public Records
Mortgage History
| Date | Status | Borrower | Loan Amount |
|---|---|---|---|
| Open | Fredman Peter | $487,500 | |
| Closed | Fredman Peter | $384,000 |
Source: Public Records
Tax History
| Year | Tax Paid | Tax Assessment Tax Assessment Total Assessment is a certain percentage of the fair market value that is determined by local assessors to be the total taxable value of land and additions on the property. | Land | Improvement |
|---|---|---|---|---|
| 2025 | $11,863 | $735,024 | $208,540 | $533,484 |
| 2024 | $11,863 | $720,477 | $204,452 | $523,025 |
| 2023 | $11,606 | $713,218 | $200,445 | $512,773 |
| 2022 | $11,382 | $692,235 | $196,515 | $502,720 |
| 2021 | $11,397 | $678,529 | $192,663 | $492,866 |
| 2020 | $10,758 | $678,504 | $190,689 | $487,815 |
| 2019 | $10,303 | $665,203 | $186,950 | $478,253 |
| 2018 | $10,120 | $652,163 | $183,286 | $468,877 |
| 2017 | $9,758 | $639,379 | $179,693 | $459,686 |
| 2016 | $9,423 | $626,847 | $176,171 | $450,676 |
| 2015 | $9,292 | $617,434 | $173,525 | $443,909 |
| 2014 | $9,169 | $605,342 | $170,127 | $435,215 |
Source: Public Records
Map
Nearby Homes
- 1901 Parker St Unit 3
- 2018 Blake St
- 2701 Grant St
- 1645 Dwight Way
- 1612 Parker St
- 1612 Carleton St
- 2926 Ellis St
- 2057 Emerson St
- 2110 Ashby Ave
- 2923 Wheeler St
- 1515 Derby St
- 1530 Stuart St
- 2319 Ward St
- 2550 Dana St Unit 2F
- 2750 Sacramento St
- 1646 Ashby Ave
- 2758 Sacramento St
- 1450 Ward St
- 2774 Sacramento St
- 2782 Sacramento St
- 1925 Carleton St
- 1915 Carleton St
- 1931 Carleton St
- 1911 Carleton St
- 1933 Carleton St
- 1907 Carleton St
- 1918 Parker St
- 1920 Parker St
- 1914 Parker St
- 1922 Parker St
- 1912 Parker St
- 1924 Parker St
- 1935 Carleton St Unit A
- 1935 Carleton St Unit B
- 1926 Parker St
- 2609 Martin Luther King jr Way
- 2617 Martin Luther King jr Way
- 2615 Martin Luther King jr Way
- 2621 Martin Luther King jr Way
- 1908 Parker St
Your Personal Tour Guide
Ask me questions while you tour the home.