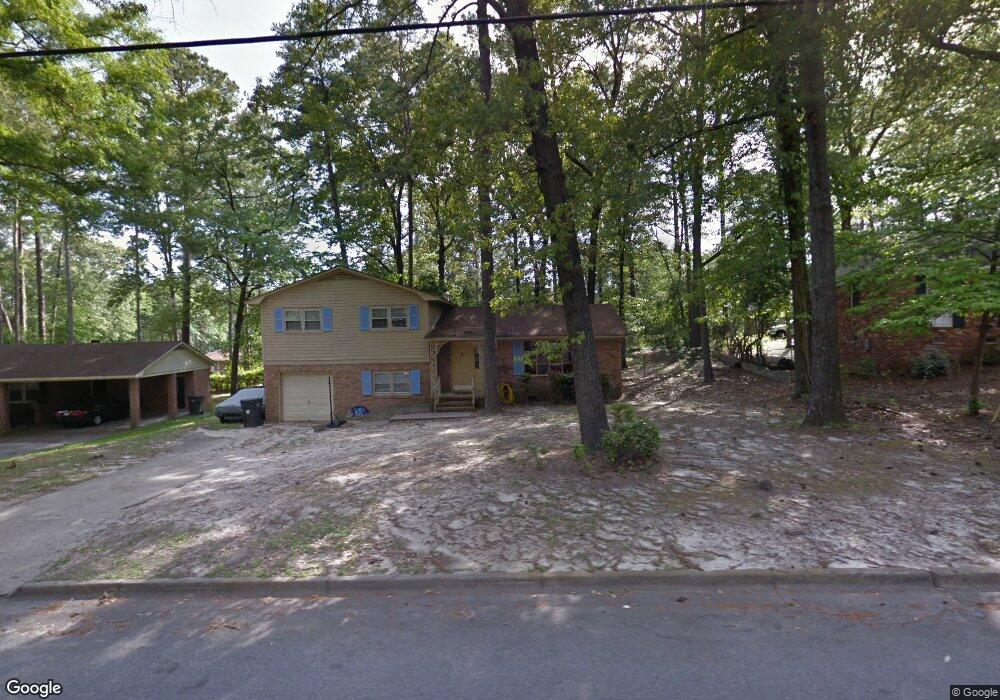
1917 Valley Spring Rd Augusta, GA 30909
North Leg NeighborhoodEstimated Value: $170,048 - $203,000
4
Beds
2
Baths
1,350
Sq Ft
$137/Sq Ft
Est. Value
About This Home
This home is located at 1917 Valley Spring Rd, Augusta, GA 30909 and is currently estimated at $184,512, approximately $136 per square foot. 1917 Valley Spring Rd is a home located in Richmond County with nearby schools including Copeland Elementary School, Johnson Magnet, and Academy of Richmond County High School.
Ownership History
Date
Name
Owned For
Owner Type
Purchase Details
Closed on
May 15, 1992
Sold by
Housing & Urban Development Secretary Of
Bought by
Clayton David R
Current Estimated Value
Purchase Details
Closed on
May 5, 1992
Sold by
Housing & Urban Dev
Bought by
Clayton David R
Purchase Details
Closed on
Jan 2, 1992
Sold by
Secretary Of Hud
Bought by
Secretary Of Hud
Purchase Details
Closed on
Oct 16, 1991
Sold by
Dominion Bankshares Mortgage Corp
Bought by
Housing & Urban Development Secretary Of
Purchase Details
Closed on
Sep 3, 1991
Sold by
Dominion Dominion and Dominion Bankshares
Bought by
Housing & Urban Dev
Purchase Details
Closed on
Mar 30, 1987
Sold by
Fleet Finance Inc
Bought by
Bowen Terrence E
Purchase Details
Closed on
Mar 1, 1987
Sold by
Fleet Finance Inc
Bought by
Bowen Terrence E
Purchase Details
Closed on
Dec 1, 1986
Sold by
Tyus Willie J Jr By
Bought by
Fleet Finance Inc
Purchase Details
Closed on
May 1, 1986
Create a Home Valuation Report for This Property
The Home Valuation Report is an in-depth analysis detailing your home's value as well as a comparison with similar homes in the area
Home Values in the Area
Average Home Value in this Area
Purchase History
| Date | Buyer | Sale Price | Title Company |
|---|---|---|---|
| Clayton David R | -- | -- | |
| Clayton David R | $58,000 | -- | |
| Secretary Of Hud | -- | -- | |
| Housing & Urban Development Secretary Of | -- | -- | |
| Dominion Bankshares Mortgage Corp | -- | -- | |
| Housing & Urban Dev | $65,500 | -- | |
| .Dominion Bankshares | $65,500 | -- | |
| Bowen Terrence E | $62,300 | -- | |
| Bowen Terrence E | $62,300 | -- | |
| Fleet Finance Inc | $56,400 | -- | |
| -- | $70,000 | -- |
Source: Public Records
Tax History
| Year | Tax Paid | Tax Assessment Tax Assessment Total Assessment is a certain percentage of the fair market value that is determined by local assessors to be the total taxable value of land and additions on the property. | Land | Improvement |
|---|---|---|---|---|
| 2025 | $2,095 | $65,484 | $8,000 | $57,484 |
| 2024 | $2,095 | $65,704 | $8,000 | $57,704 |
| 2023 | $1,517 | $64,040 | $8,000 | $56,040 |
| 2022 | $1,621 | $48,762 | $8,000 | $40,762 |
| 2021 | $1,429 | $38,614 | $8,000 | $30,614 |
| 2020 | $1,424 | $39,104 | $8,000 | $31,104 |
| 2019 | $1,499 | $39,104 | $8,000 | $31,104 |
| 2018 | $1,508 | $39,104 | $8,000 | $31,104 |
| 2017 | $1,455 | $39,104 | $8,000 | $31,104 |
| 2016 | $1,456 | $39,104 | $8,000 | $31,104 |
| 2015 | $1,465 | $39,104 | $8,000 | $31,104 |
| 2014 | $1,466 | $39,075 | $8,000 | $31,075 |
Source: Public Records
Map
Nearby Homes
- 3009 Bramble Wood Trail
- 3254 Summerchase Cir
- 3004 Bramble Wood Trail
- 3242 Summerchase Cir
- 1904 Aspen Green Way
- 1602 Wildwood Dr
- 2141 Veterans Dr
- 2145 Veterans Dr
- 3314 Idlewild Dr
- 2149 NW Veterans Dr
- 3314 Forest Estates Dr
- 1426 Springview Dr
- 3317 Forest Estates Dr
- 1421 Springview Dr
- 1219 Sande Hill Place
- 1413 Springview Dr
- 3221 Alpine Rd
- 3427 Heather Dr
- 1223 Reid Rd
- 3340 Bardot Dr
- 1915 Valley Spring Rd
- 1919 Valley Spring Rd
- 3111 Eagle Rock Rd
- 3109 Eagle Rock Rd
- 2312 Belair Spring Rd
- 1913 Valley Spring Rd
- 3113 Eagle Rock Rd
- 1914 Valley Spring Rd
- 1912 Valley Spring Rd
- 1921 Valley Spring Rd
- 3107 Eagle Rock Rd
- 1916 Valley Spring Rd
- 1910 Valley Spring Rd
- 3115 Eagle Rock Rd
- 1911 Valley Spring Rd
- 1923 Valley Spring Rd
- 1903 Flintwood Dr
- 3104 Eagle Rock Rd
- 3117 Eagle Rock Rd
- 3105 Eagle Rock Rd
Your Personal Tour Guide
Ask me questions while you tour the home.