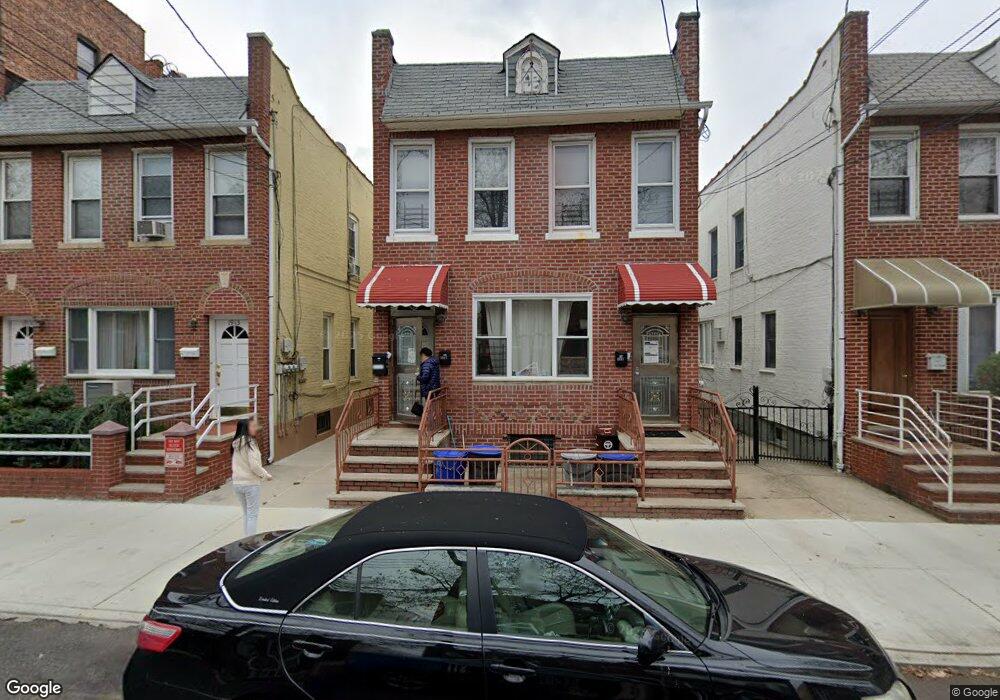
1917 W 10th St Brooklyn, NY 11223
Gravesend NeighborhoodEstimated Value: $1,524,574 - $1,876,000
Studio
--
Bath
2,480
Sq Ft
$690/Sq Ft
Est. Value
About This Home
This home is located at 1917 W 10th St, Brooklyn, NY 11223 and is currently estimated at $1,712,394, approximately $690 per square foot. 1917 W 10th St is a home located in Kings County with nearby schools including P.S. 97 - The Highlawn, Is 228 David A Boody, and Hebrew Language Academy Charter 2.
Ownership History
Date
Name
Owned For
Owner Type
Purchase Details
Closed on
Jan 28, 2009
Sold by
Caleca Antonino
Bought by
Chan Kin Ling and Wong Kei Wa
Current Estimated Value
Home Financials for this Owner
Home Financials are based on the most recent Mortgage that was taken out on this home.
Original Mortgage
$600,000
Outstanding Balance
$382,507
Interest Rate
5.26%
Mortgage Type
Purchase Money Mortgage
Estimated Equity
$1,329,887
Create a Home Valuation Report for This Property
The Home Valuation Report is an in-depth analysis detailing your home's value as well as a comparison with similar homes in the area
Home Values in the Area
Average Home Value in this Area
Purchase History
| Date | Buyer | Sale Price | Title Company |
|---|---|---|---|
| Chan Kin Ling | $815,000 | -- |
Source: Public Records
Mortgage History
| Date | Status | Borrower | Loan Amount |
|---|---|---|---|
| Open | Chan Kin Ling | $600,000 |
Source: Public Records
Tax History
| Year | Tax Paid | Tax Assessment Tax Assessment Total Assessment is a certain percentage of the fair market value that is determined by local assessors to be the total taxable value of land and additions on the property. | Land | Improvement |
|---|---|---|---|---|
| 2025 | $10,185 | $91,080 | $17,040 | $74,040 |
| 2024 | $10,185 | $89,760 | $17,040 | $72,720 |
| 2023 | $9,700 | $88,980 | $17,040 | $71,940 |
| 2022 | $6,729 | $87,600 | $17,040 | $70,560 |
| 2021 | $9,465 | $79,860 | $17,040 | $62,820 |
| 2020 | $4,667 | $75,120 | $17,040 | $58,080 |
| 2019 | $8,791 | $75,120 | $17,040 | $58,080 |
| 2018 | $8,054 | $40,968 | $8,977 | $31,991 |
| 2017 | $7,579 | $38,650 | $9,019 | $29,631 |
| 2016 | $7,417 | $38,650 | $10,287 | $28,363 |
| 2015 | $4,178 | $38,358 | $11,410 | $26,948 |
| 2014 | $4,178 | $36,188 | $11,949 | $24,239 |
Source: Public Records
Map
Nearby Homes
Your Personal Tour Guide
Ask me questions while you tour the home.