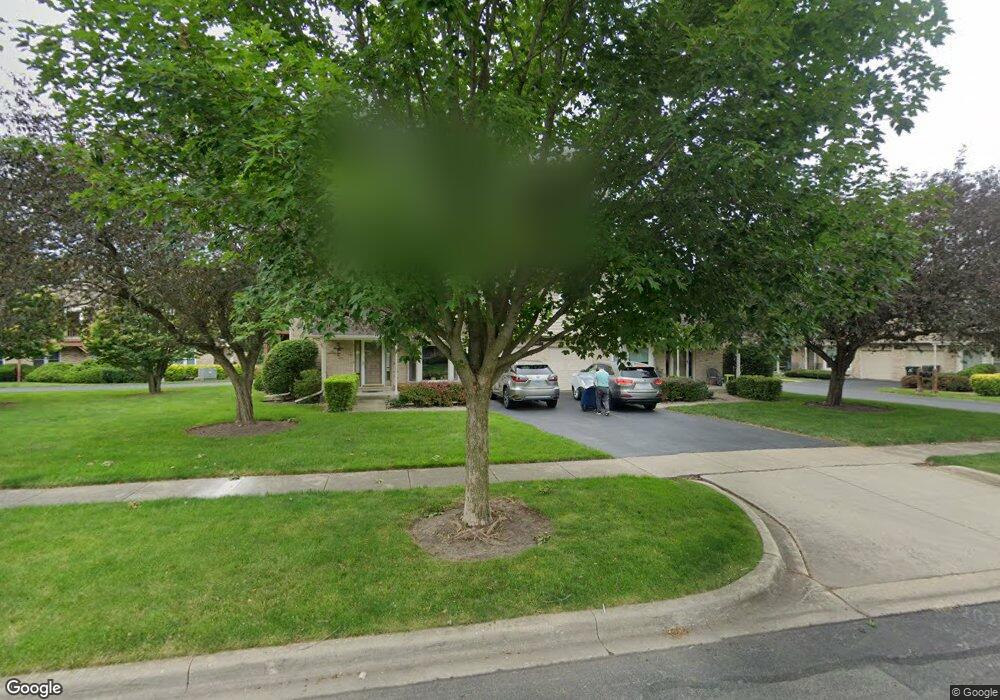
1917 Wisteria Ct Naperville, IL 60565
Old Farm NeighborhoodEstimated Value: $322,000 - $356,000
--
Bed
1
Bath
1,269
Sq Ft
$263/Sq Ft
Est. Value
About This Home
This home is located at 1917 Wisteria Ct, Naperville, IL 60565 and is currently estimated at $333,143, approximately $262 per square foot. 1917 Wisteria Ct is a home located in DuPage County with nearby schools including Kingsley Elementary School, Lincoln Jr. High School, and Naperville Central High School.
Ownership History
Date
Name
Owned For
Owner Type
Purchase Details
Closed on
Jun 1, 2023
Sold by
Villalon Luis Vazquez
Bought by
Hussain Ali and Muffaddal Rashida
Current Estimated Value
Purchase Details
Closed on
Dec 3, 2021
Sold by
Ghrir Mohamad Taka
Bought by
Villalon Luis Vazquez
Purchase Details
Closed on
Feb 15, 2019
Sold by
Declarati Borsellino Mary Anne and Declarati Mary Anne Borsellino
Bought by
Ghrir Mohamad Taha
Purchase Details
Closed on
May 6, 2003
Sold by
Borsellino Mary Anne
Bought by
Borsellino Mary Anne and The Mary Anne Borsellino Declaration Of
Purchase Details
Closed on
Jan 5, 1996
Sold by
Borsellino Mary Anne and Mcginley Mary Anne
Bought by
Boorsellino Mary Anne
Create a Home Valuation Report for This Property
The Home Valuation Report is an in-depth analysis detailing your home's value as well as a comparison with similar homes in the area
Home Values in the Area
Average Home Value in this Area
Purchase History
| Date | Buyer | Sale Price | Title Company |
|---|---|---|---|
| Hussain Ali | $290,000 | Fidelity National Title | |
| Villalon Luis Vazquez | $269,000 | Fidelity National Title | |
| Ghrir Mohamad Taha | $160,000 | First American Title | |
| Borsellino Mary Anne | -- | -- | |
| Boorsellino Mary Anne | -- | -- |
Source: Public Records
Tax History Compared to Growth
Tax History
| Year | Tax Paid | Tax Assessment Tax Assessment Total Assessment is a certain percentage of the fair market value that is determined by local assessors to be the total taxable value of land and additions on the property. | Land | Improvement |
|---|---|---|---|---|
| 2024 | $4,567 | $82,550 | $8,481 | $74,069 |
| 2023 | $4,376 | $75,340 | $7,740 | $67,600 |
| 2022 | $3,989 | $67,630 | $7,040 | $60,590 |
| 2021 | $3,834 | $65,070 | $6,770 | $58,300 |
| 2020 | $3,748 | $63,900 | $6,650 | $57,250 |
| 2019 | $3,629 | $61,130 | $6,360 | $54,770 |
| 2018 | $3,582 | $60,400 | $6,280 | $54,120 |
| 2017 | $3,501 | $58,360 | $6,070 | $52,290 |
| 2016 | $3,423 | $56,250 | $5,850 | $50,400 |
| 2015 | $3,386 | $52,970 | $5,510 | $47,460 |
| 2014 | $3,354 | $51,060 | $5,310 | $45,750 |
| 2013 | $3,304 | $51,180 | $5,320 | $45,860 |
Source: Public Records
Map
Nearby Homes
- 1921 Wisteria Ct Unit 3
- 35 Foxcroft Rd Unit 123
- 47 Glencoe Ct Unit 102D
- 23 Glencoe Ct Unit 202B
- 2132 Berkley Ct Unit 201A
- 302 Carriage Hill Rd
- 312 Leeds Ct
- 1751 S Washington St Unit 1
- 336 Brooklea Ct
- 2337 Worthing Dr Unit 102A
- 2279 Kaskaskia Ct
- 2167 Countryside Cir
- 2276 Kaskaskia Ct
- 138 E Bailey Rd Unit M
- 128 E Bailey Rd Unit G
- 517 Sheffield Rd
- 158 E Bailey Rd Unit F
- 2280 Barth Dr
- 621 Bourbon Ct
- 1537 Lighthouse Dr
- 1917 Wisteria Ct Unit 2
- 1917 Wisteria Ct Unit 3
- 1917 Wisteria Ct Unit 1
- 1917 Wisteria Ct Unit 4
- 1909 Wisteria Ct Unit 4
- 1909 Wisteria Ct Unit 2
- 1909 Wisteria Ct
- 1909 Wisteria Ct Unit 3
- 1909 Wisteria Ct Unit 1
- 1921 Wisteria Ct Unit 2
- 1921 Wisteria Ct Unit 4
- 1921 Wisteria Ct Unit 1
- 1921 Wisteria Ct
- 1925 Wisteria Ct Unit 5
- 1925 Wisteria Ct Unit 2
- 1925 Wisteria Ct Unit 3
- 1925 Wisteria Ct Unit 4
- 1925 Wisteria Ct Unit 1
- 1925 Wisteria Ct Unit 6
- 1913 Wisteria Ct Unit 4