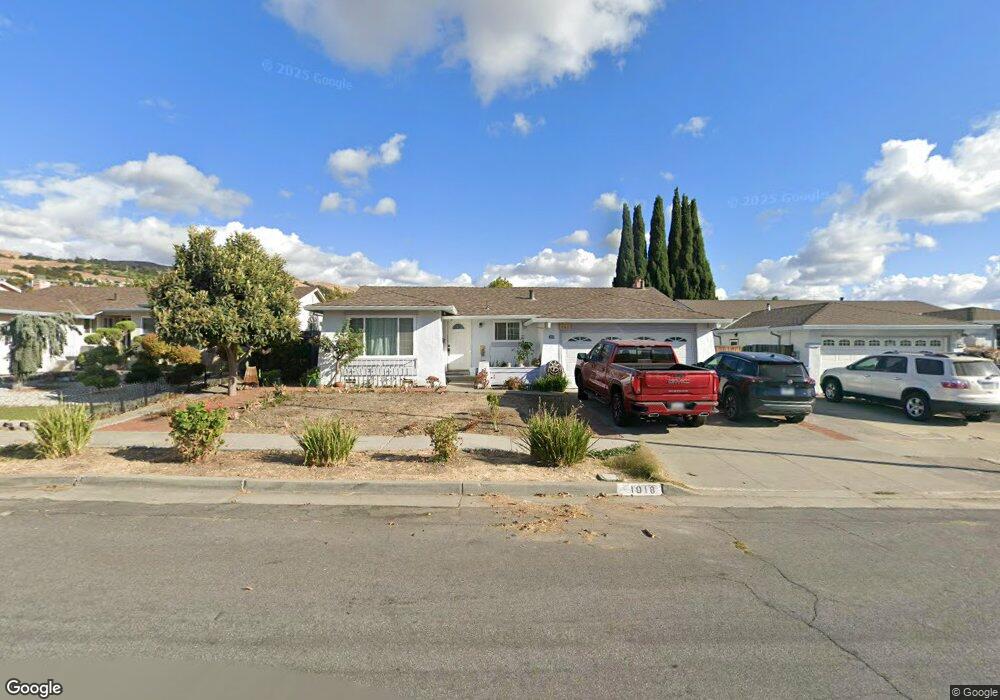
1918 Half Pence Way San Jose, CA 95132
Majestic NeighborhoodEstimated Value: $1,577,950 - $1,911,000
4
Beds
2
Baths
1,480
Sq Ft
$1,149/Sq Ft
Est. Value
About This Home
This home is located at 1918 Half Pence Way, San Jose, CA 95132 and is currently estimated at $1,700,488, approximately $1,148 per square foot. 1918 Half Pence Way is a home located in Santa Clara County with nearby schools including Majestic Way Elementary School, Sierramont Middle School, and Piedmont Hills High School.
Ownership History
Date
Name
Owned For
Owner Type
Purchase Details
Closed on
Apr 3, 2002
Sold by
Meng Shu Ying
Bought by
Zhang Nian Zu and Pan Suzhen
Current Estimated Value
Home Financials for this Owner
Home Financials are based on the most recent Mortgage that was taken out on this home.
Original Mortgage
$400,000
Interest Rate
6.37%
Purchase Details
Closed on
Jun 24, 1998
Sold by
Wang David C and Ying Shu
Bought by
Meng Shu Ying
Home Financials for this Owner
Home Financials are based on the most recent Mortgage that was taken out on this home.
Original Mortgage
$207,750
Interest Rate
6.9%
Create a Home Valuation Report for This Property
The Home Valuation Report is an in-depth analysis detailing your home's value as well as a comparison with similar homes in the area
Home Values in the Area
Average Home Value in this Area
Purchase History
| Date | Buyer | Sale Price | Title Company |
|---|---|---|---|
| Zhang Nian Zu | $500,000 | Old Republic Title Company | |
| Meng Shu Ying | -- | Fidelity National Title Co |
Source: Public Records
Mortgage History
| Date | Status | Borrower | Loan Amount |
|---|---|---|---|
| Previous Owner | Zhang Nian Zu | $400,000 | |
| Previous Owner | Meng Shu Ying | $207,750 |
Source: Public Records
Tax History Compared to Growth
Tax History
| Year | Tax Paid | Tax Assessment Tax Assessment Total Assessment is a certain percentage of the fair market value that is determined by local assessors to be the total taxable value of land and additions on the property. | Land | Improvement |
|---|---|---|---|---|
| 2025 | $10,673 | $738,632 | $295,451 | $443,181 |
| 2024 | $10,673 | $724,150 | $289,658 | $434,492 |
| 2023 | $10,481 | $709,952 | $283,979 | $425,973 |
| 2022 | $10,440 | $696,032 | $278,411 | $417,621 |
| 2021 | $10,103 | $682,385 | $272,952 | $409,433 |
| 2020 | $9,793 | $675,389 | $270,154 | $405,235 |
| 2019 | $9,421 | $662,147 | $264,857 | $397,290 |
| 2018 | $9,289 | $649,164 | $259,664 | $389,500 |
| 2017 | $9,344 | $636,436 | $254,573 | $381,863 |
| 2016 | $8,957 | $623,958 | $249,582 | $374,376 |
| 2015 | $8,854 | $614,587 | $245,834 | $368,753 |
| 2014 | $8,142 | $602,549 | $241,019 | $361,530 |
Source: Public Records
Map
Nearby Homes
- 3437 Duchess Ct
- 3453 Trafalgar Place
- 3555 Laurant Way
- 3211 Parkhaven Dr
- 1545 Stone Creek Dr
- 3252 Cropley Ave
- 3248 Woody Ln
- 3070 Ironside Ct
- 2844 Parkrow Ln
- 3544 Madrid Dr
- 3093 Melchester Dr
- 2085 Ashwood Ln
- 3108 Kermath Dr
- 3139 Laneview Dr
- 2327 Farmcrest St
- 1398 Vance Dr
- 1756 Valhalla Ct
- 3513 Ivalynn Cir
- 1612 Tahoe Dr
- 1710 Clear Lake Ave
- 1924 Half Pence Way
- 1912 Half Pence Way
- 3379 Farthing Way
- 3383 Farthing Way
- 1906 Half Pence Way
- 1930 Half Pence Way
- 3375 Farthing Way
- 3387 Farthing Way
- 1917 Half Pence Way
- 1923 Half Pence Way
- 1911 Half Pence Way
- 1938 Half Pence Way
- 3307 Half Pence Ct
- 1929 Half Pence Way
- 3371 Farthing Way
- 3391 Farthing Way
- 3303 Half Pence Ct
- 1905 Half Pence Way
- 3313 Half Pence Ct
- 1935 Half Pence Way