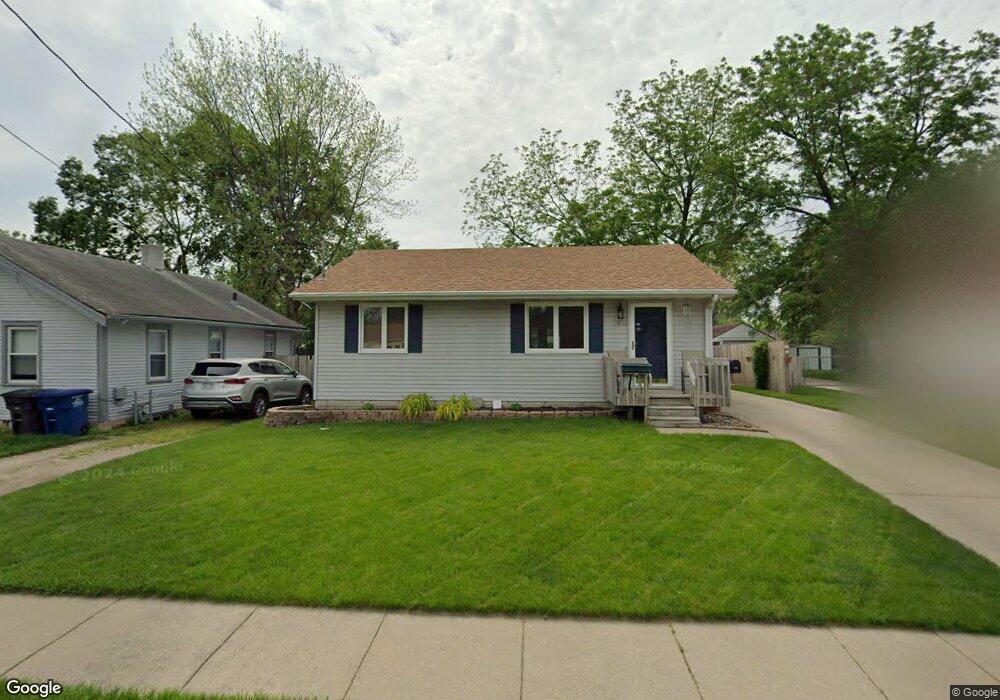
1918 Lay St Des Moines, IA 50317
Fairmont Park NeighborhoodEstimated Value: $173,000 - $185,000
2
Beds
1
Bath
832
Sq Ft
$213/Sq Ft
Est. Value
About This Home
This home is located at 1918 Lay St, Des Moines, IA 50317 and is currently estimated at $176,869, approximately $212 per square foot. 1918 Lay St is a home located in Polk County with nearby schools including Phillips Elementary, Goodrell Middle School, and North High School.
Ownership History
Date
Name
Owned For
Owner Type
Purchase Details
Closed on
Aug 25, 2017
Sold by
Dudley Dean C
Bought by
Blue Heeler Properties Lc
Current Estimated Value
Purchase Details
Closed on
Jun 7, 2001
Sold by
Vanrossum David
Bought by
Vanrossum David and Lumley Jodi L
Home Financials for this Owner
Home Financials are based on the most recent Mortgage that was taken out on this home.
Original Mortgage
$98,100
Interest Rate
7.18%
Purchase Details
Closed on
Feb 16, 1998
Sold by
Barnes Realty L C
Bought by
Vanrossum David
Home Financials for this Owner
Home Financials are based on the most recent Mortgage that was taken out on this home.
Original Mortgage
$79,294
Interest Rate
6.99%
Mortgage Type
FHA
Purchase Details
Closed on
Apr 14, 1997
Sold by
Nahas Edward F and Nahas Maret
Bought by
Barnes Realty L C
Create a Home Valuation Report for This Property
The Home Valuation Report is an in-depth analysis detailing your home's value as well as a comparison with similar homes in the area
Home Values in the Area
Average Home Value in this Area
Purchase History
| Date | Buyer | Sale Price | Title Company |
|---|---|---|---|
| Blue Heeler Properties Lc | -- | None Available | |
| Vanrossum David | -- | -- | |
| Vanrossum David | $79,000 | -- | |
| Barnes Realty L C | $2,500 | -- |
Source: Public Records
Mortgage History
| Date | Status | Borrower | Loan Amount |
|---|---|---|---|
| Previous Owner | Vanrossum David | $98,100 | |
| Previous Owner | Vanrossum David | $79,294 |
Source: Public Records
Tax History Compared to Growth
Tax History
| Year | Tax Paid | Tax Assessment Tax Assessment Total Assessment is a certain percentage of the fair market value that is determined by local assessors to be the total taxable value of land and additions on the property. | Land | Improvement |
|---|---|---|---|---|
| 2025 | $2,824 | $185,100 | $19,100 | $166,000 |
| 2024 | $2,824 | $162,600 | $16,600 | $146,000 |
| 2023 | $2,648 | $162,600 | $16,600 | $146,000 |
| 2022 | $2,624 | $124,600 | $13,100 | $111,500 |
| 2021 | $2,464 | $124,600 | $13,100 | $111,500 |
| 2020 | $2,552 | $110,600 | $11,600 | $99,000 |
| 2019 | $2,196 | $110,600 | $11,600 | $99,000 |
| 2018 | $2,166 | $93,500 | $9,600 | $83,900 |
| 2017 | $2,172 | $93,500 | $9,600 | $83,900 |
| 2016 | $2,110 | $92,100 | $9,200 | $82,900 |
| 2015 | $2,110 | $92,100 | $9,200 | $82,900 |
| 2014 | $2,042 | $92,100 | $9,100 | $83,000 |
Source: Public Records
Map
Nearby Homes
- 1821 E 25th St
- 1901 E 23rd St
- 2021 E 25th St
- 1905 Searle St
- 2112 E 23rd St
- 2124 E 23rd St
- 2216 Lay St
- 1915 E 22nd St
- 2100 Searle St
- 1614 Searle St
- 1603 Searle St
- 2322 Guthrie Ave
- 1601 E 22nd St
- 2323 E 23rd St
- 2324 E 23rd St
- 2208 Tichenor St
- 2503 E 24th St
- 1410 E 23rd St
- 2645 Wisconsin Ave
- 2757 Easton Blvd