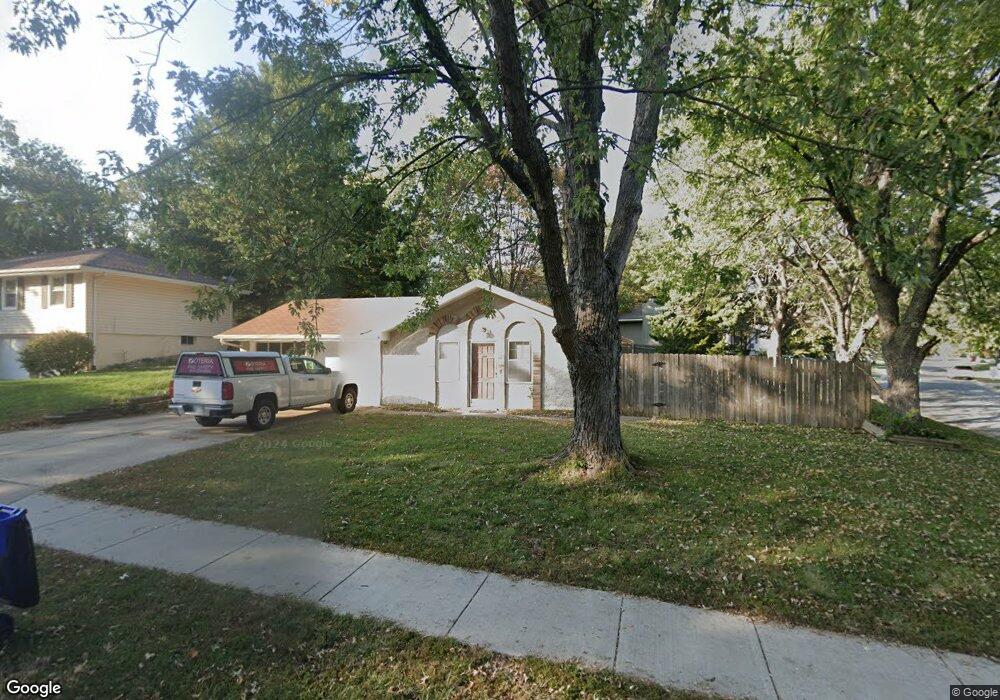
1918 SE 5th St Lees Summit, MO 64063
Estimated Value: $273,000 - $289,000
3
Beds
2
Baths
1,100
Sq Ft
$255/Sq Ft
Est. Value
About This Home
This home is located at 1918 SE 5th St, Lees Summit, MO 64063 and is currently estimated at $280,038, approximately $254 per square foot. 1918 SE 5th St is a home located in Jackson County with nearby schools including Pleasant Lea Middle School and Lee's Summit Senior High School.
Ownership History
Date
Name
Owned For
Owner Type
Purchase Details
Closed on
Jun 29, 2007
Sold by
Fultz James L
Bought by
Cravens Brian and Cravens Laura
Current Estimated Value
Home Financials for this Owner
Home Financials are based on the most recent Mortgage that was taken out on this home.
Original Mortgage
$132,453
Outstanding Balance
$81,047
Interest Rate
6.19%
Mortgage Type
Purchase Money Mortgage
Estimated Equity
$198,991
Purchase Details
Closed on
Aug 13, 2005
Sold by
Fultz Kathleen A
Bought by
Fultz James L
Purchase Details
Closed on
Apr 22, 2005
Sold by
Macdonald Richard and Macdonald Michelle W
Bought by
Fultz James L and Fultz Kathleen A
Home Financials for this Owner
Home Financials are based on the most recent Mortgage that was taken out on this home.
Original Mortgage
$124,000
Interest Rate
5.75%
Mortgage Type
Fannie Mae Freddie Mac
Create a Home Valuation Report for This Property
The Home Valuation Report is an in-depth analysis detailing your home's value as well as a comparison with similar homes in the area
Home Values in the Area
Average Home Value in this Area
Purchase History
| Date | Buyer | Sale Price | Title Company |
|---|---|---|---|
| Cravens Brian | -- | Missouri Secured Title Lees | |
| Fultz James L | -- | Metro One | |
| Fultz James L | -- | -- |
Source: Public Records
Mortgage History
| Date | Status | Borrower | Loan Amount |
|---|---|---|---|
| Open | Cravens Brian | $132,453 | |
| Previous Owner | Fultz James L | $124,000 |
Source: Public Records
Tax History
| Year | Tax Paid | Tax Assessment Tax Assessment Total Assessment is a certain percentage of the fair market value that is determined by local assessors to be the total taxable value of land and additions on the property. | Land | Improvement |
|---|---|---|---|---|
| 2025 | $2,828 | $32,665 | $7,163 | $25,502 |
| 2024 | $2,807 | $39,159 | $7,277 | $31,882 |
| 2023 | $2,807 | $39,159 | $5,901 | $33,258 |
| 2022 | $1,994 | $24,700 | $6,432 | $18,268 |
| 2021 | $2,035 | $24,700 | $6,432 | $18,268 |
| 2020 | $1,961 | $23,568 | $6,432 | $17,136 |
| 2019 | $1,907 | $23,568 | $6,432 | $17,136 |
| 2018 | $1,912 | $21,925 | $3,206 | $18,719 |
| 2016 | $1,883 | $21,377 | $4,408 | $16,969 |
Source: Public Records
Map
Nearby Homes
- 301 SE Greystone Dr
- 628 SE Ashton Dr
- 1724 SE 5th Terrace
- 312 SE Battery Dr
- 648 SE Ashton Dr
- 113 SE Bristol Dr
- 2221 SE 5th Terrace
- 413 SE Ashton Dr
- 620 SE Sumpter Dr
- 1708 SE 7th Terrace
- 116 NE Greystone Dr
- 1508 SE Long Place
- 412 NE Crescent St
- 1308 SE 7th St
- 1604 SE 11th St
- 1023 SE Timbercreek Ln
- 1305 SE 6th St
- 521 SE Asheville Dr
- 1611 NE Duchess Dr
- 1205 SE 5th St
- 1916 SE 5th St
- 1919 SE 5th St
- 414 SE Crescent St
- 2000 SE 5th St
- 1914 SE 5th St
- 2001 SE 5th St
- 1917 SE 5th St
- 2003 SE 5th St
- 1915 SE 5th St
- 413 SE Crescent St
- 412 SE Crescent St
- 2004 SE 5th St
- 2007 SE 5th St
- 407 SE Jackson St
- 1913 SE 5th St
- 410 SE Crescent St
- 411 SE Crescent St
- 410 SE Crescent N A
- 405 SE Jackson St
- 412 SE Jackson St
Your Personal Tour Guide
Ask me questions while you tour the home.