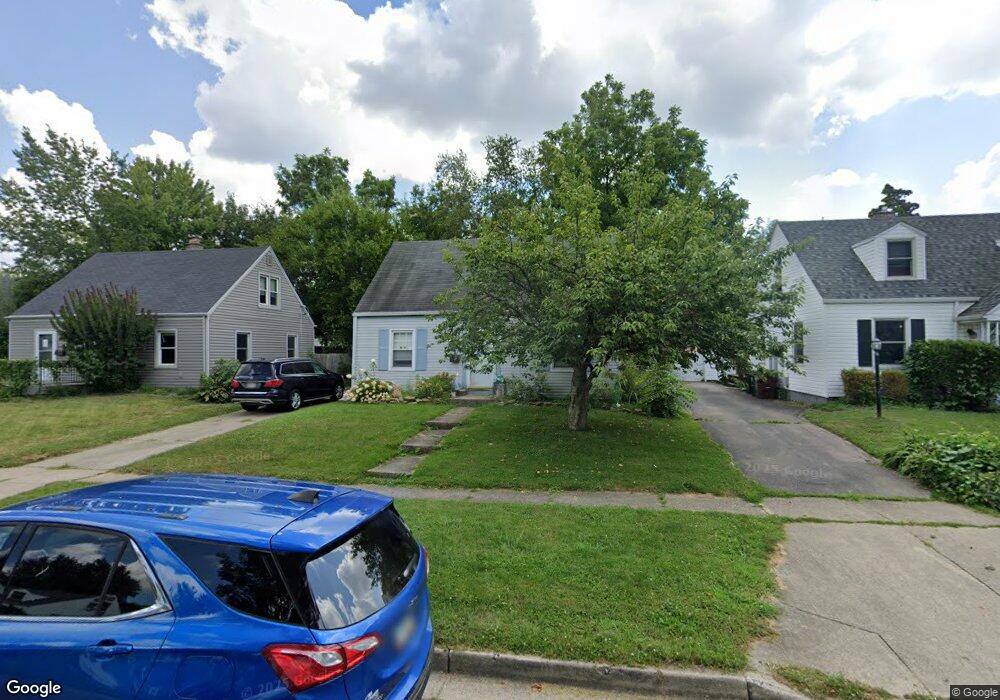
1918 W Bataan Dr Dayton, OH 45420
Estimated Value: $176,000 - $183,274
3
Beds
1
Bath
1,008
Sq Ft
$178/Sq Ft
Est. Value
About This Home
This home is located at 1918 W Bataan Dr, Dayton, OH 45420 and is currently estimated at $179,069, approximately $177 per square foot. 1918 W Bataan Dr is a home located in Montgomery County with nearby schools including Greenmont Elementary School, Kettering Middle School, and Kettering Fairmont High School.
Ownership History
Date
Name
Owned For
Owner Type
Purchase Details
Closed on
Feb 2, 2021
Sold by
Hust Joshua and Hust Hailey
Bought by
Hust Joshua and Hust Hailey
Current Estimated Value
Home Financials for this Owner
Home Financials are based on the most recent Mortgage that was taken out on this home.
Original Mortgage
$108,829
Outstanding Balance
$97,336
Interest Rate
2.7%
Mortgage Type
FHA
Estimated Equity
$81,733
Purchase Details
Closed on
Apr 12, 2019
Sold by
Blonstein Barbara Diane File and Blonstein Fredric A
Bought by
Rust Joshua and Lucker Hailey
Home Financials for this Owner
Home Financials are based on the most recent Mortgage that was taken out on this home.
Original Mortgage
$109,971
Interest Rate
4.62%
Mortgage Type
FHA
Purchase Details
Closed on
Aug 17, 2018
Sold by
Rivers Joyce M
Bought by
Blonstein Barbara Diane File
Create a Home Valuation Report for This Property
The Home Valuation Report is an in-depth analysis detailing your home's value as well as a comparison with similar homes in the area
Home Values in the Area
Average Home Value in this Area
Purchase History
| Date | Buyer | Sale Price | Title Company |
|---|---|---|---|
| Hust Joshua | -- | Avenue 365 Lender Svcs Llc | |
| Rust Joshua | $112,000 | Fidelity Lawyers Ttl Agcy Ll | |
| Blonstein Barbara Diane File | $30,000 | Landmark Title Agency South |
Source: Public Records
Mortgage History
| Date | Status | Borrower | Loan Amount |
|---|---|---|---|
| Open | Hust Joshua | $108,829 | |
| Closed | Rust Joshua | $109,971 |
Source: Public Records
Tax History Compared to Growth
Tax History
| Year | Tax Paid | Tax Assessment Tax Assessment Total Assessment is a certain percentage of the fair market value that is determined by local assessors to be the total taxable value of land and additions on the property. | Land | Improvement |
|---|---|---|---|---|
| 2024 | $3,268 | $52,190 | $11,010 | $41,180 |
| 2023 | $3,268 | $52,190 | $11,010 | $41,180 |
| 2022 | $2,891 | $36,440 | $7,700 | $28,740 |
| 2021 | $2,677 | $36,440 | $7,700 | $28,740 |
| 2020 | $2,684 | $36,440 | $7,700 | $28,740 |
| 2019 | $2,514 | $30,140 | $7,700 | $22,440 |
| 2018 | $2,528 | $30,140 | $7,700 | $22,440 |
| 2017 | $2,331 | $30,140 | $7,700 | $22,440 |
| 2016 | $2,177 | $26,420 | $7,700 | $18,720 |
| 2015 | $2,140 | $26,420 | $7,700 | $18,720 |
| 2014 | $2,140 | $26,420 | $7,700 | $18,720 |
| 2012 | -- | $29,780 | $8,400 | $21,380 |
Source: Public Records
Map
Nearby Homes
- 1914 W Bataan Dr
- 1910 Roop Place
- 2139 E Bataan Dr
- 1744 Woodman Dr
- 1512 Horlacher Ave
- 1513 Horlacher Ave
- 1840 Culver Ave
- 2830 Kennedy Ave
- 4802 Amesborough Rd
- 2530 Barryknoll St
- 2004 Hazel Ave
- 4643 Amesborough Rd
- 1701 Marilyn Ave
- 1829 Hazel Ave
- 2603 Kennedy Ave
- 5369 Haverfield Rd
- 2908 Kingston Ave
- 1300 Watervliet Ave
- 2704 Hazel Ave
- 4549 Amesborough Rd
- 1922 W Bataan Dr
- 1910 W Bataan Dr
- 1926 W Bataan Dr
- 1927 Malcom Dr
- 1923 Malcom Dr
- 1931 Malcom Dr
- 1930 W Bataan Dr
- 1906 W Bataan Dr
- 1919 Malcom Dr
- 1935 Malcom Dr
- 1919 W Bataan Dr
- 1915 W Bataan Dr
- 1923 W Bataan Dr
- 1840 Rainbow Dr
- 1934 W Bataan Dr
- 1911 W Bataan Dr
- 1915 Malcom Dr
- 1927 W Bataan Dr
- 1939 Malcom Dr
- 1907 W Bataan Dr